4 Performance Analysis
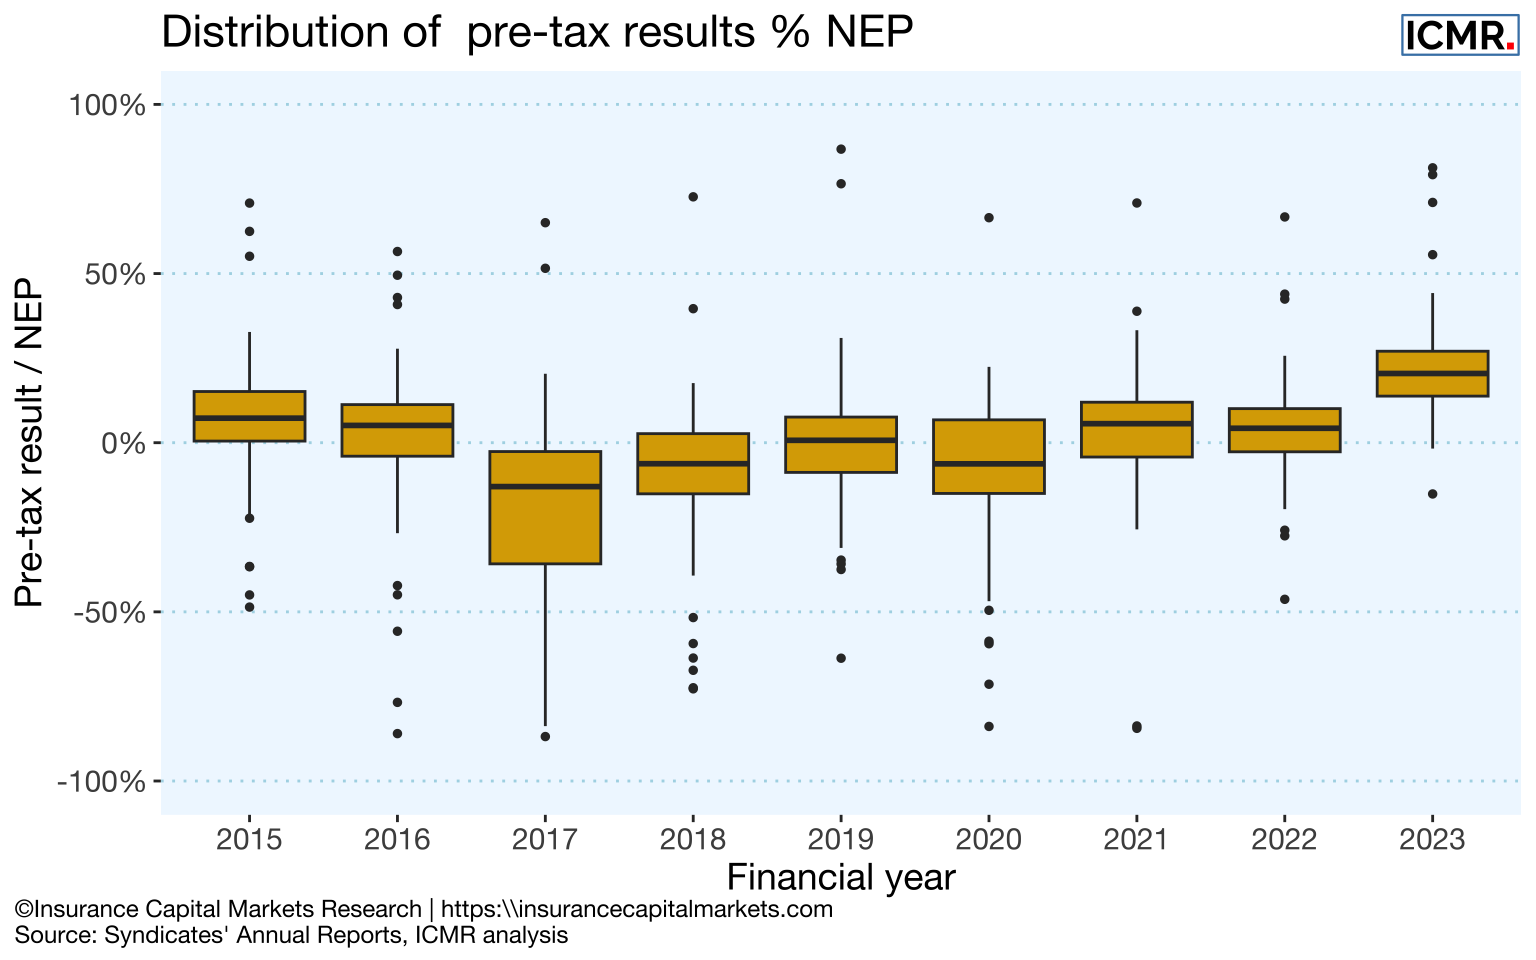
In 2023 Lloyd’s reported an aggregate pre-tax profit of £10,663m, a 28.9% margin on net earned premium (NEP), compared to a -2.4% loss on NEP in 2022. But as always the aggregate figures hide the distribution of results across the market.
The following box whisker plot shows the range of pre-tax results as a function of NEP over time and across non-life syndicates, i.e. excluding life, SPAs, SiaB, legacy writers and run-offs. In 2023 nearly all syndicates reported a pre-tax profit, unlike in any year since 2015.
The top 10 most profitable syndicates pre-tax at each of the last 5 year ends are not necessarily the top 10 syndicates by size, as measured by gross written premium (GWP), as the following tables illustrate:
| Pre-tax result | 2019 | 2020 | 2021 | 2022 | 2023 |
|---|---|---|---|---|---|
| 1 | TMK 510 | Liberty 4472 | AXA XL 2003 | Beazley 2623 | Beazley 2623 |
| 2 | Liberty 4472 | QBE 2999 | Beazley 2623 | Hiscox 33 | QBE 2999 |
| 3 | Beazley 2623 | Chubb 2488 | Hiscox 33 | Nephila 2357 | Chaucer 1084 |
| 4 | QBE 2999 | Ascot 1414 | Talbot 1183 | Aegis 1225 | Hiscox 33 |
| 5 | Chubb 2488 | Aegis 1225 | Chaucer 1084 | Ark 4020 | Ariel Re 1910 |
| 6 | Chaucer 1084 | Atrium 609 | Liberty 4472 | Talbot 1183 | MS Amlin 2001 |
| 7 | Atrium 609 | Faraday 435 | Munich Re 457 | Munich Re 457 | BRIT 2987 |
| 8 | MS Amlin 2001 | QBE 386 | Aegis 1225 | TMK 510 | Nephila 2357 |
| 9 | BRIT 2987 | IQUW 218 | TMK 510 | Atrium 609 | Canopius 4444 |
| 10 | Talbot 1183 | MAP 2791 | Atrium 609 | Asta Beat 4242 | Chubb 2488 |
| GWP | 2019 | 2020 | 2021 | 2022 | 2023 |
|---|---|---|---|---|---|
| 1 | AXA XL 2003 | Beazley 2623 | Beazley 2623 | Beazley 2623 | Beazley 2623 |
| 2 | MS Amlin 2001 | BRIT 2987 | BRIT 2987 | BRIT 2987 | QBE 2999 |
| 3 | Beazley 2623 | AXA XL 2003 | Hiscox 33 | QBE 2999 | BRIT 2987 |
| 4 | BRIT 2987 | Hiscox 33 | QBE 2999 | Canopius 4444 | Chaucer 1084 |
| 5 | Hiscox 33 | TMK 510 | Liberty 4472 | Hiscox 33 | Canopius 4444 |
| 6 | TMK 510 | QBE 2999 | Canopius 4444 | Liberty 4472 | Hiscox 33 |
| 7 | Canopius 4444 | MS Amlin 2001 | TMK 510 | Chaucer 1084 | TMK 510 |
| 8 | Liberty 4472 | Liberty 4472 | AXA XL 2003 | MS Amlin 2001 | MS Amlin 2001 |
| 9 | QBE 2999 | Chaucer 1084 | MS Amlin 2001 | TMK 510 | Liberty 4472 |
| 10 | Chaucer 1084 | Canopius 4444 | Chaucer 1084 | Ascot 1414 | Ascot 1414 |
4.1 Underwriting performance in 2023
The following bar charts show the underwriting performance ratios by syndicate.
Given the extra costs and capital loadings usually applied to start up syndicates, the charts show that 2023 was clearly a good time to commence underwriting.
4.2 Distribution of underwriting performance
The following charts present the distribution of underwriting performance across syndicates in the Lloyd’s market.
The chart illustrates the impact of the insurance cycle.
In the soft part of the cycle only the best performing syndicates delivered an underwriting profit, whereas in the harder part of the cycle the vast majority of syndicates have combined ratios under 100%.
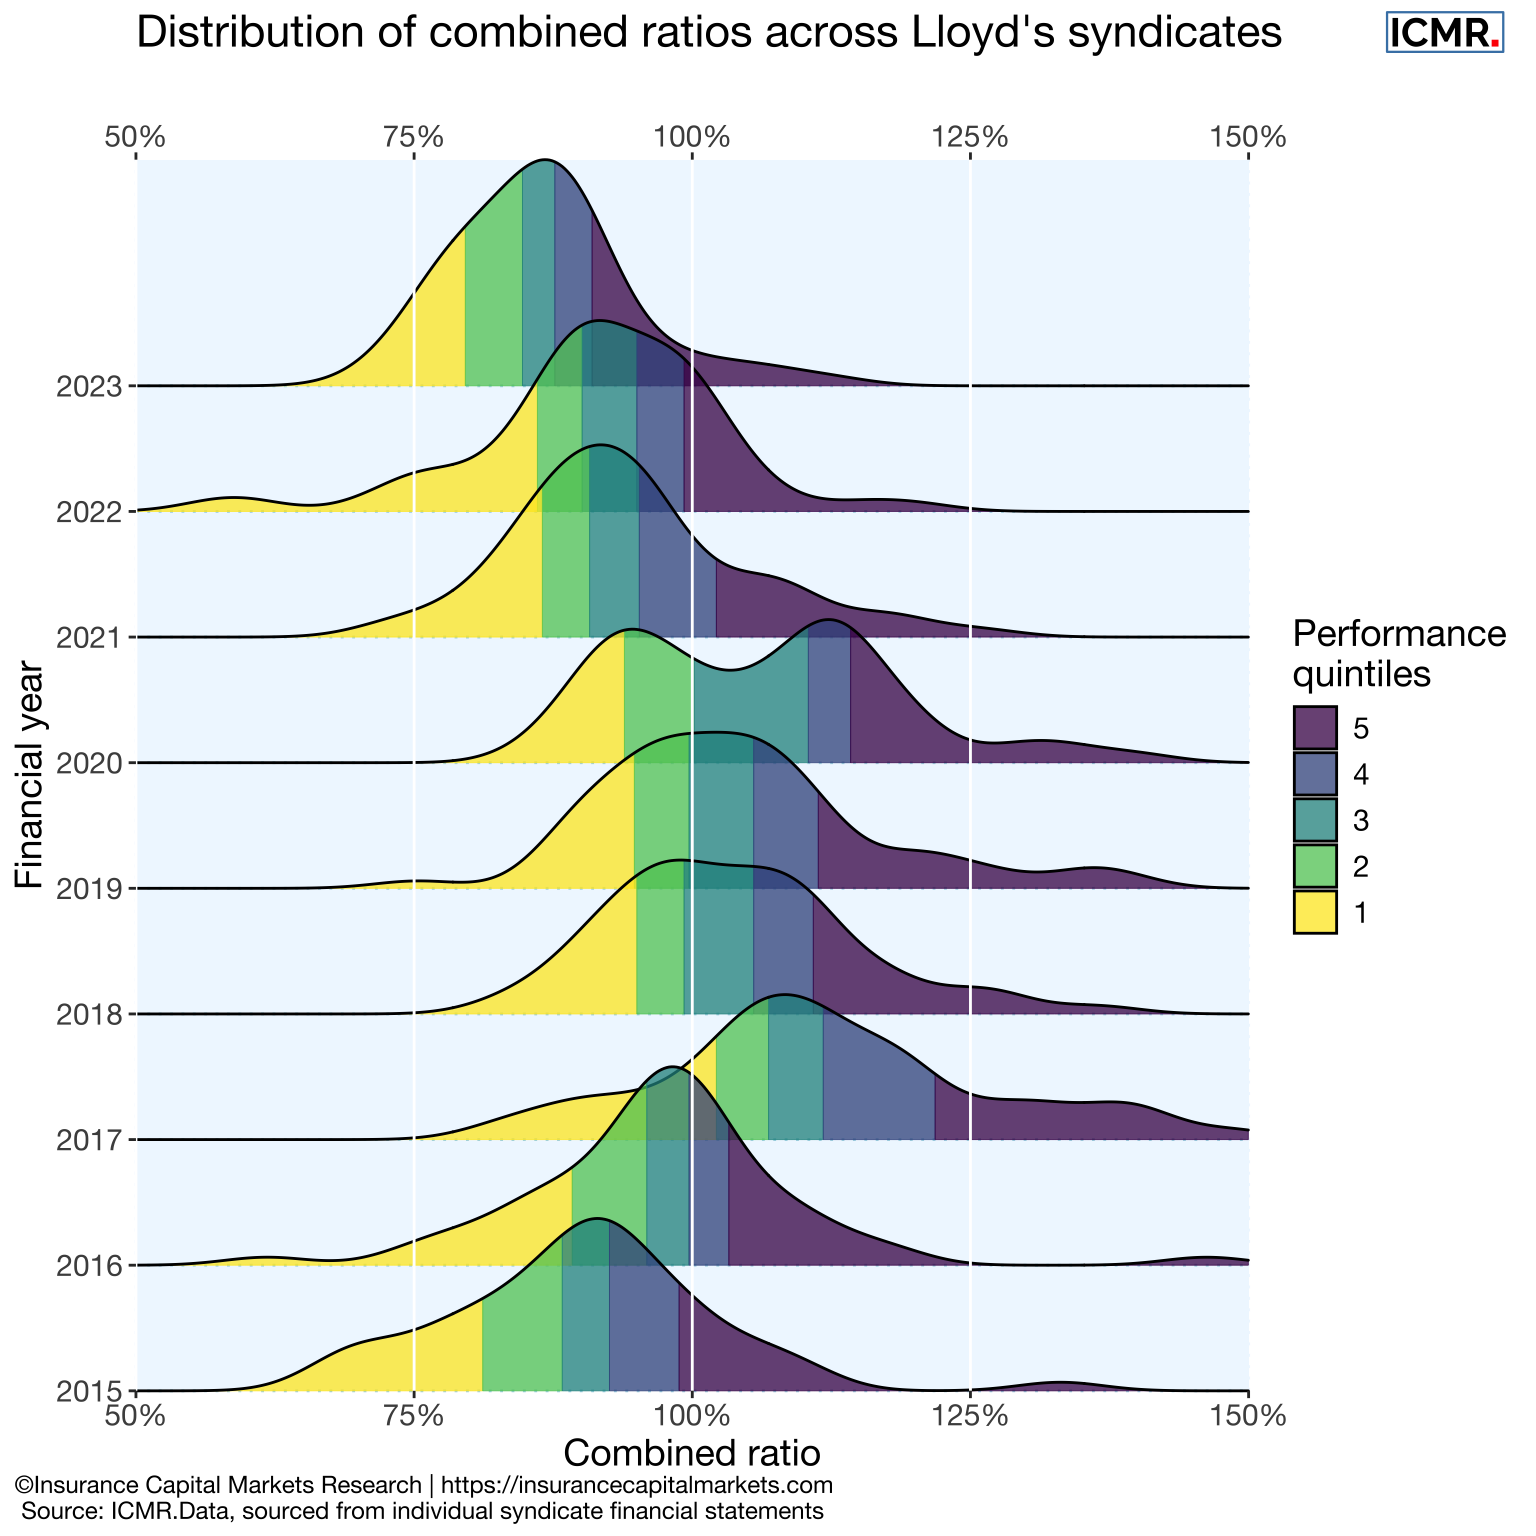
The “double hump” in the combined ratio distribution of 2020 was caused by a combination of concentration of Covid losses along with an increase reinsurance costs, including reinstatements, for certain syndicates.
4.3 Consistency of relative performance
Similar to sports league tables, the underwriting performance of a syndicate relative to others is quite stable over time. Perhaps, this is not surprising given the size of renewal books for many syndicates.
The table below shows the frequencies of syndicates migrating from one combined ratio quartile position to another quartile in the following year over the period from 2015 to 2023.
| From/To | Top | 2nd | 3rd | Bottom |
|---|---|---|---|---|
| Top | 50% | 25% | 14.5% | 10.5% |
| 2nd | 23.3% | 36% | 27.9% | 12.8% |
| 3rd | 12.6% | 24.1% | 37.9% | 25.3% |
| Bottom | 7.7% | 15.4% | 28.2% | 48.7% |
From the diagonal we can see the probability that the performance quartile of a given syndicate will remain the same the following year. For a 4th quartile performer, the chances are 48.7% that it remains a bottom performer, while a 1st quartile performer has a 50% likelihood of remaining top quartile the following year. Equally for a 3rd quartile performer, only 24.1% improve to the 2nd quartile in the following year, while 25.3% drop to the 4th quartile.
This consistency of relative performance, whether in a major loss year or a relatively benign loss year, is a distinctive feature of underwriting performance and not just of syndicates within Lloyd’s. It can also be observed, albeit with elevated volatility, within classes of business which can help in parameterising risk models, and predict prospective relative performance.
ICMR have developed models to predict future relative performance at a whole account and class of business level.