7 Investment Analysis
Investment returns, as a function of individual syndicate’s investable assets, have followed the fortunes of the fixed income market over time. Depending on what mix of business syndicates underwrite, one syndicate’s investable assets could be many times that of another for the same unit of net earned premium.
The generally low interest rate environment is evident at the beginning of the period, followed by the material mark-to-market losses at year end 2022 following the uptick in inflation and interest rates. Returns appear now to be stable again around prevailing interest rates.
7.1 Investment returns
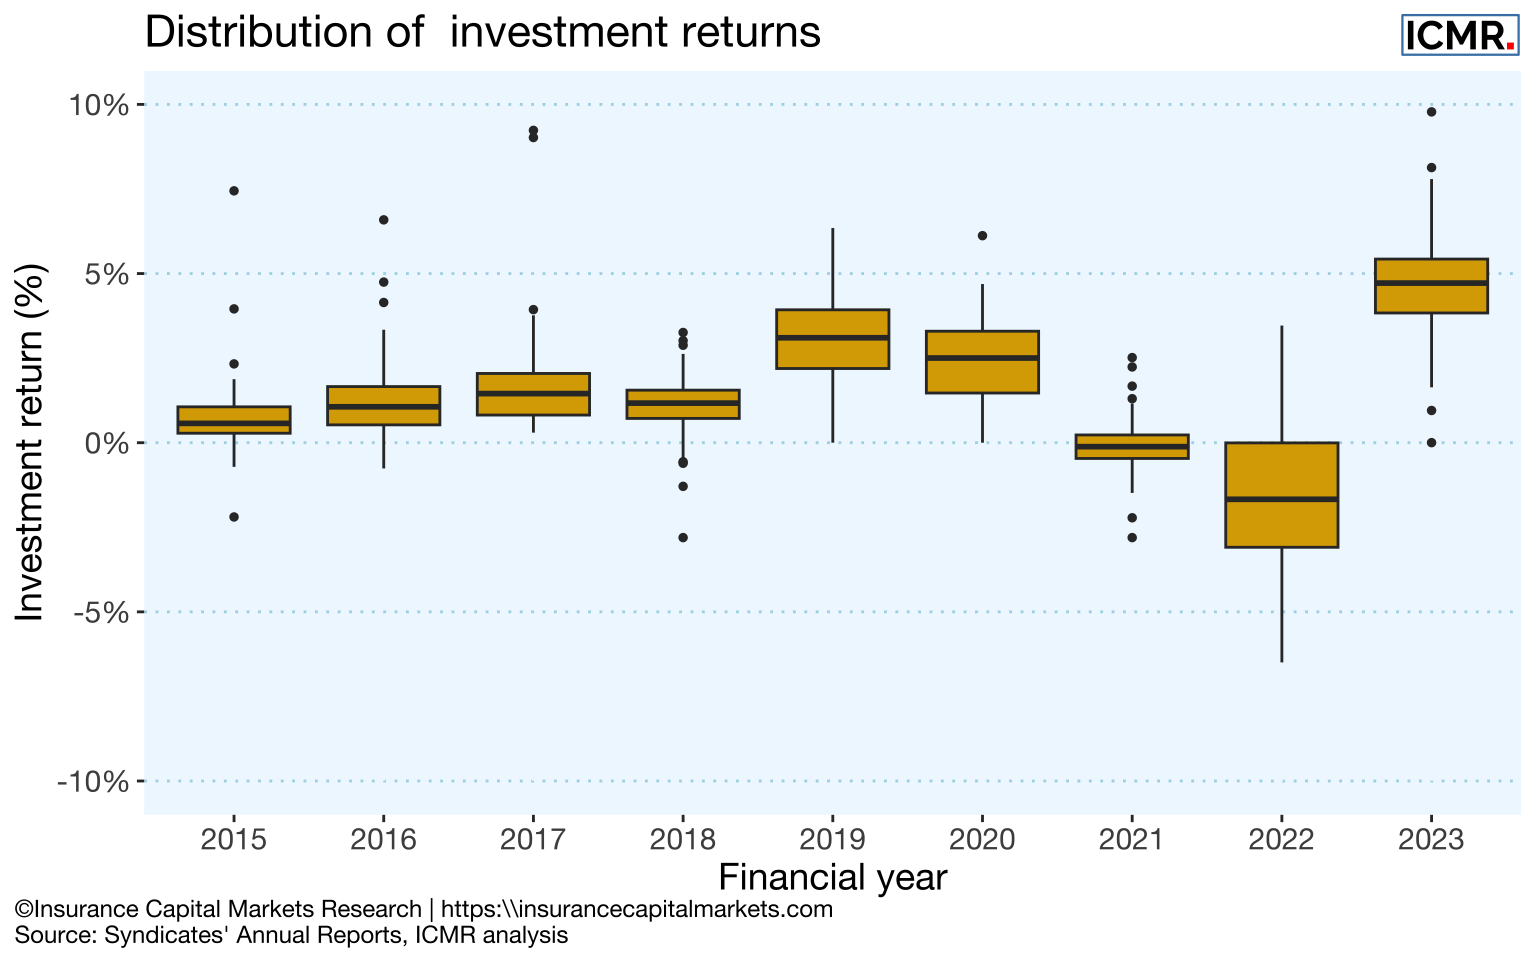
It should be noted that these figures do not include investment return on capital required to underwrite (Funds at Lloyd’s) as this is added at a market level in Lloyd’s pro-forma accounts.
7.2 Underwriting vs investment income
The following charts show the correlation between syndicates’ investment returns and underwriting results over the last two year ends. For most syndicates over both years, underwriting performance has been a more significant contributor than investment income. It is also apparent from the wider spread in 2022 that in a difficult year for investment results, different syndicate investment policies become more of a differentiator. It should be said that this effect is seen in UK GAAP figures where mark to market movements cause profit volatility, whereas the same effect would not be seen in IFRS or US GAAP.
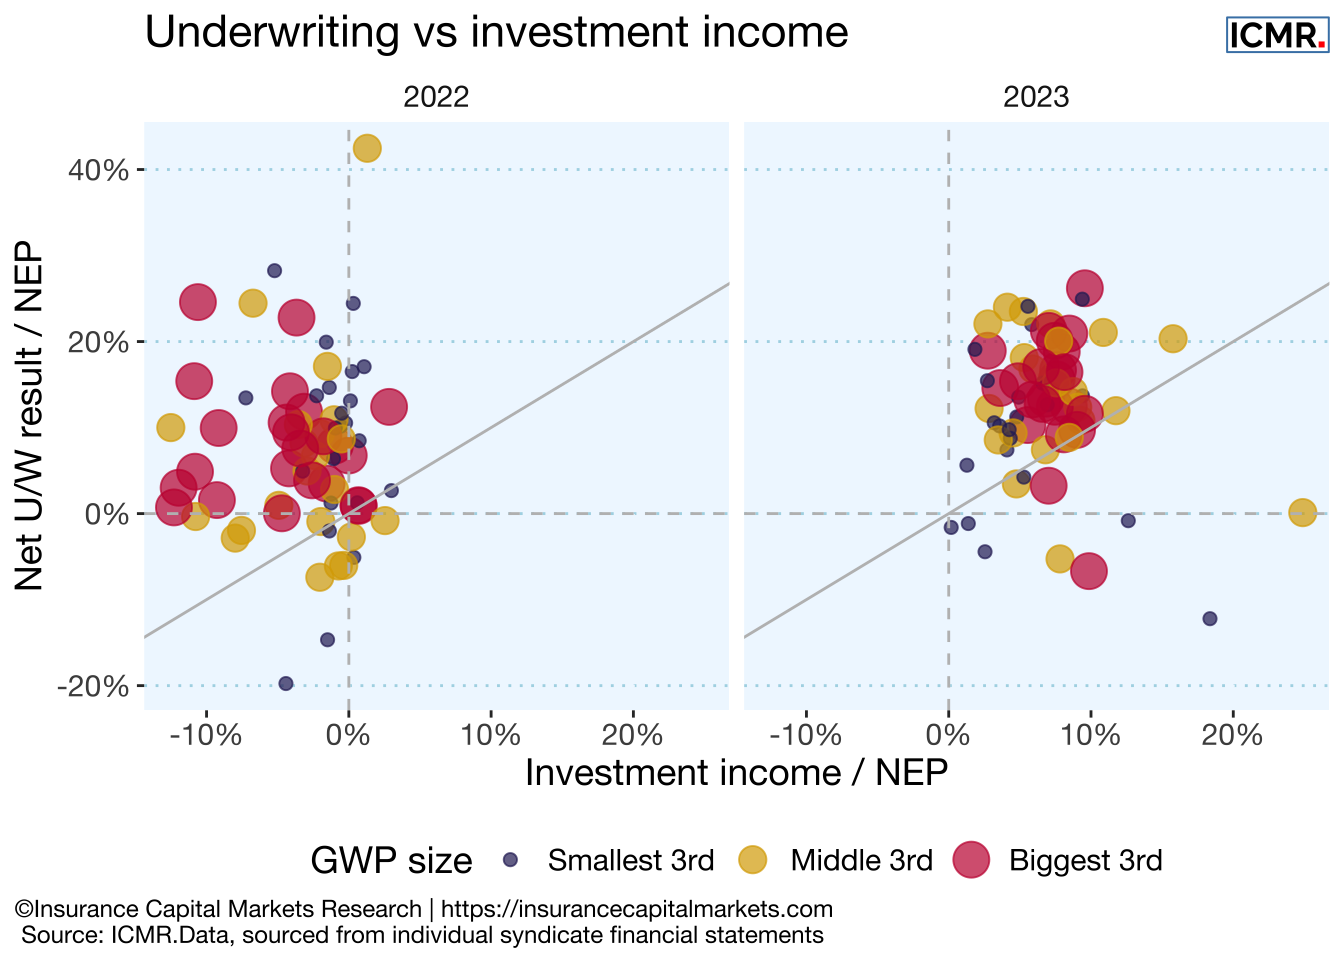
The spread of investment income as a function of net earned premium illustrates the difference in asset leverage that exists between syndicates, dependent on their mix of business and average claims duration.