2 Lloyd’s Results
2.1 Lloyd’s delivers amongst its best ever performance
Lloyd’s is delivering on its promises of returns to investors, with profits to market participants at an all time high. This has arisen from both favourable trading conditions across most classes of business as well as a return to more normal investment valuations following the mark-to-market losses of 2022.
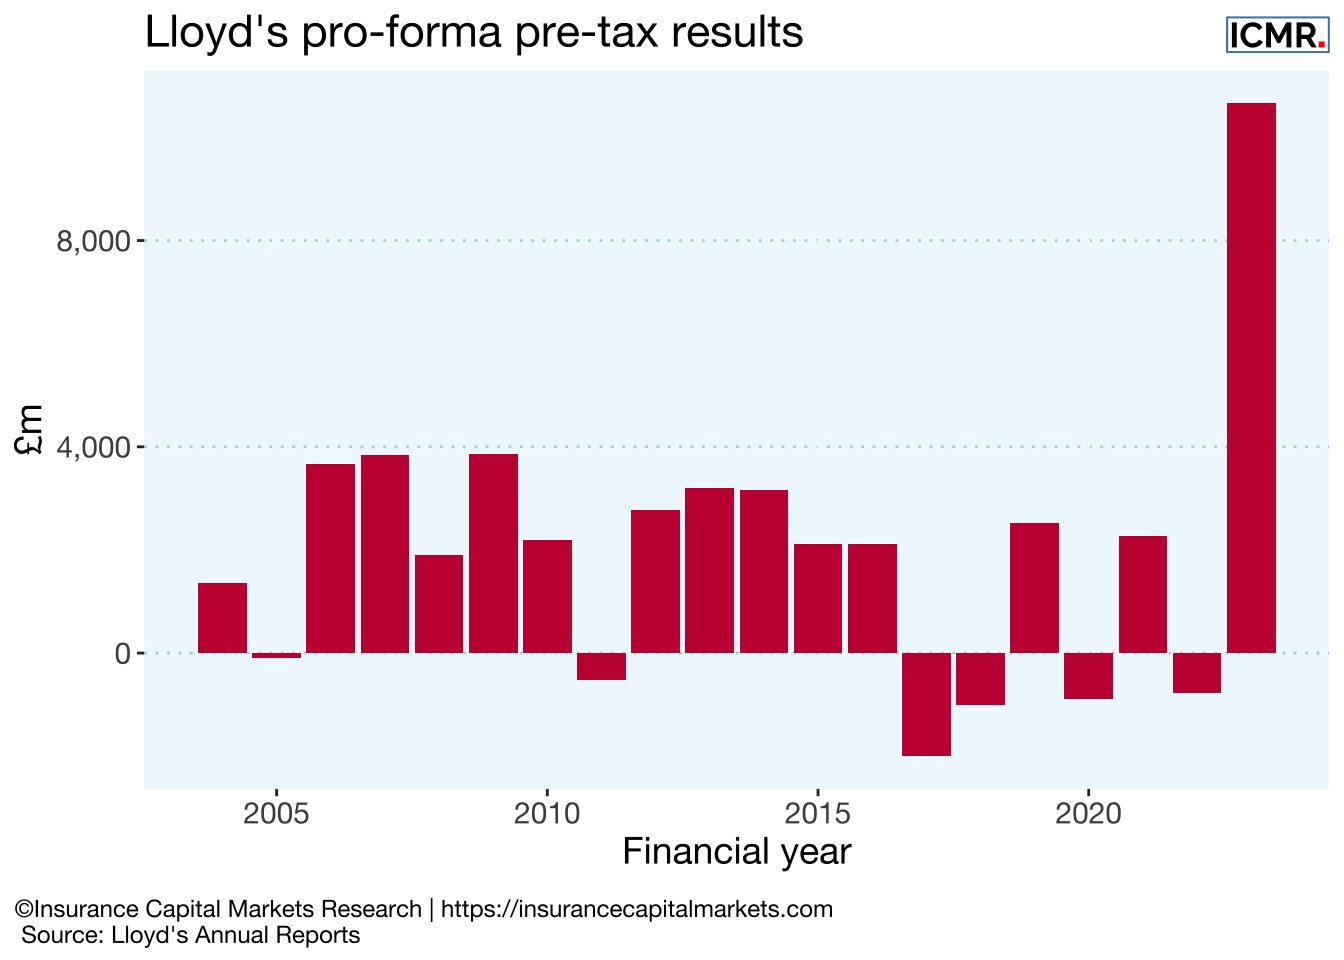
For the 2023 (2022) financial year Lloyd’s reported £52,149m (£46,705m) of gross written premium, with an underwriting result of £5,910m (£2,641m) and pre-tax profit of £10,663m (-£769m). The combined ratio was 84.0% (91.9%), the return on investment improved to 5.4% (-3.5%) and the return on capital reached 25.3% (-2.0%), its best return since 2007.
Looking at the 20 year time horizon, essentially encompassing at least two full underwriting cycles, in Figure 2.2 we can see that cumulatively, Lloyd’s has written £560bn of gross premium and made a cumulative net profit of £40bn. This includes notional investment return on Funds at Lloyd’s and Lloyd’s central assets and takes account of reinsurance premiums paid as well as recoveries made and all expenses, as follows:
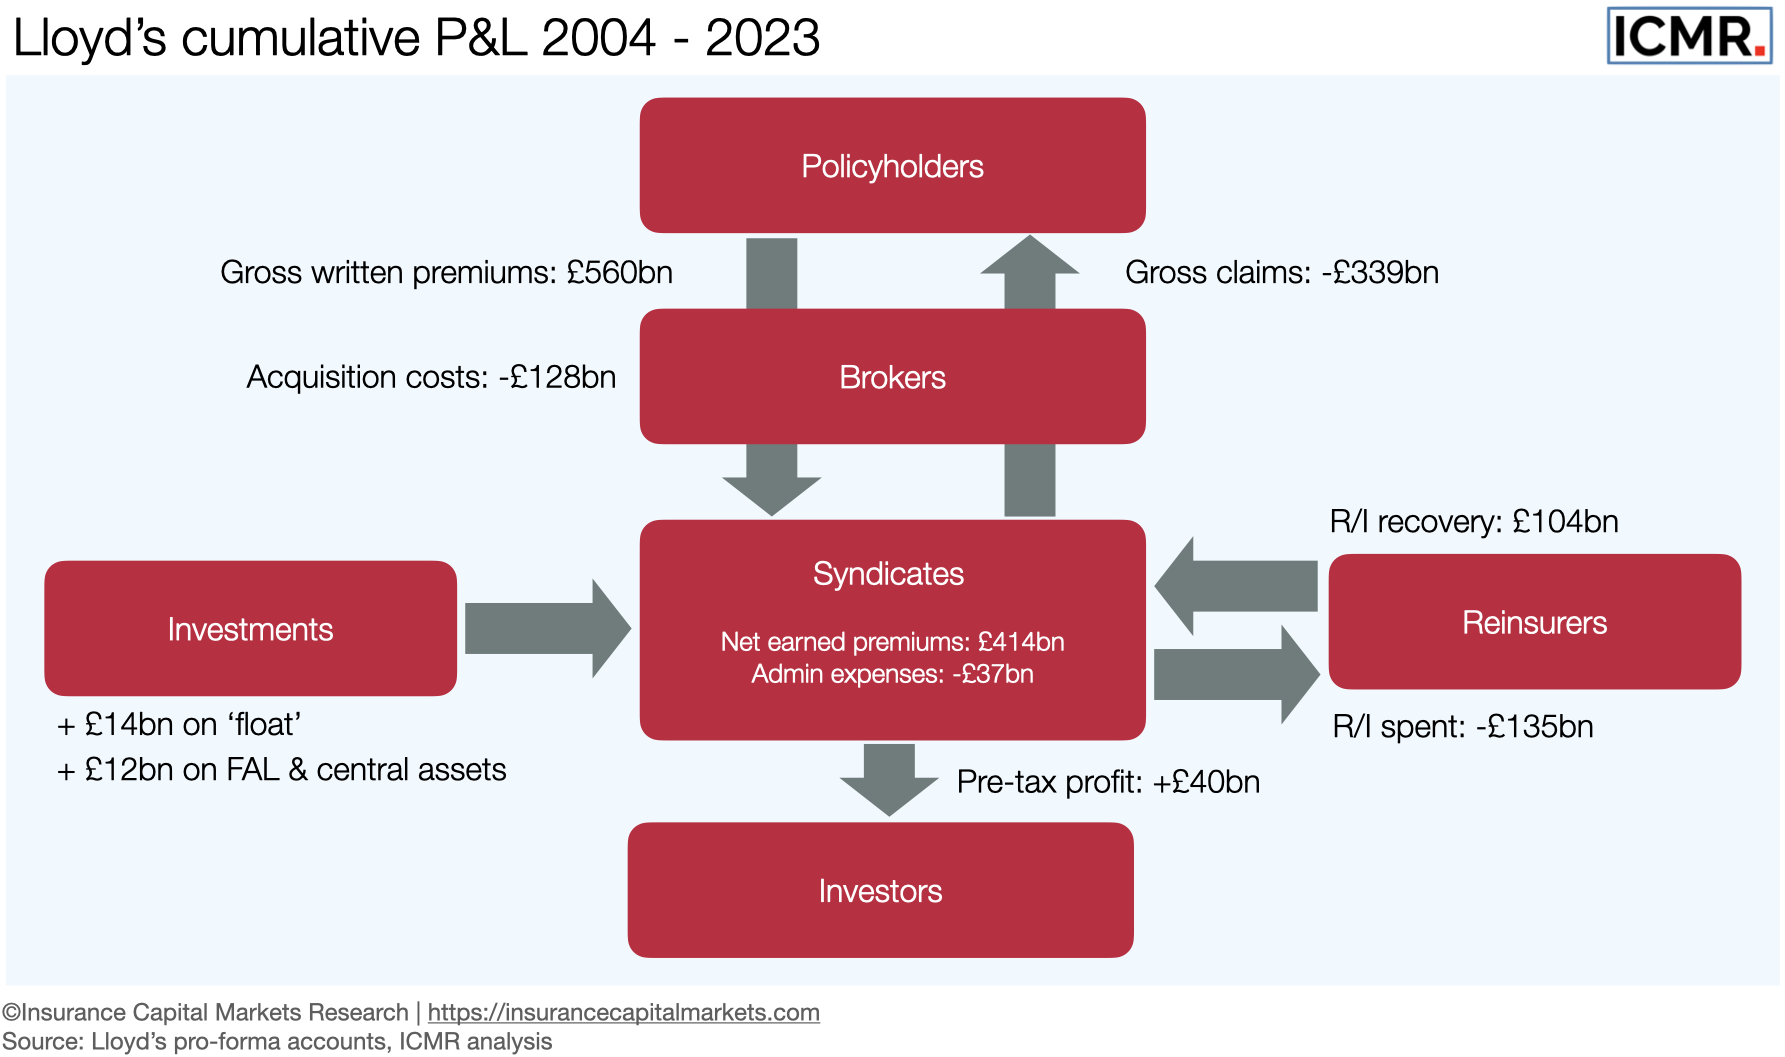
The market has paid its reinsurers (noting that a portion of reinsurance premium is churned between syndicates) £135bn and collected back over £104bn in recoveries. This represents sharing approximately half the pre-tax profit with reinsurers, reflecting the benefit reinsurers have delivered in reducing the market’s volatility and therefore capital requirements. The market’s largest cost, gross claims to policyholders, have amounted to £339bn over the period.
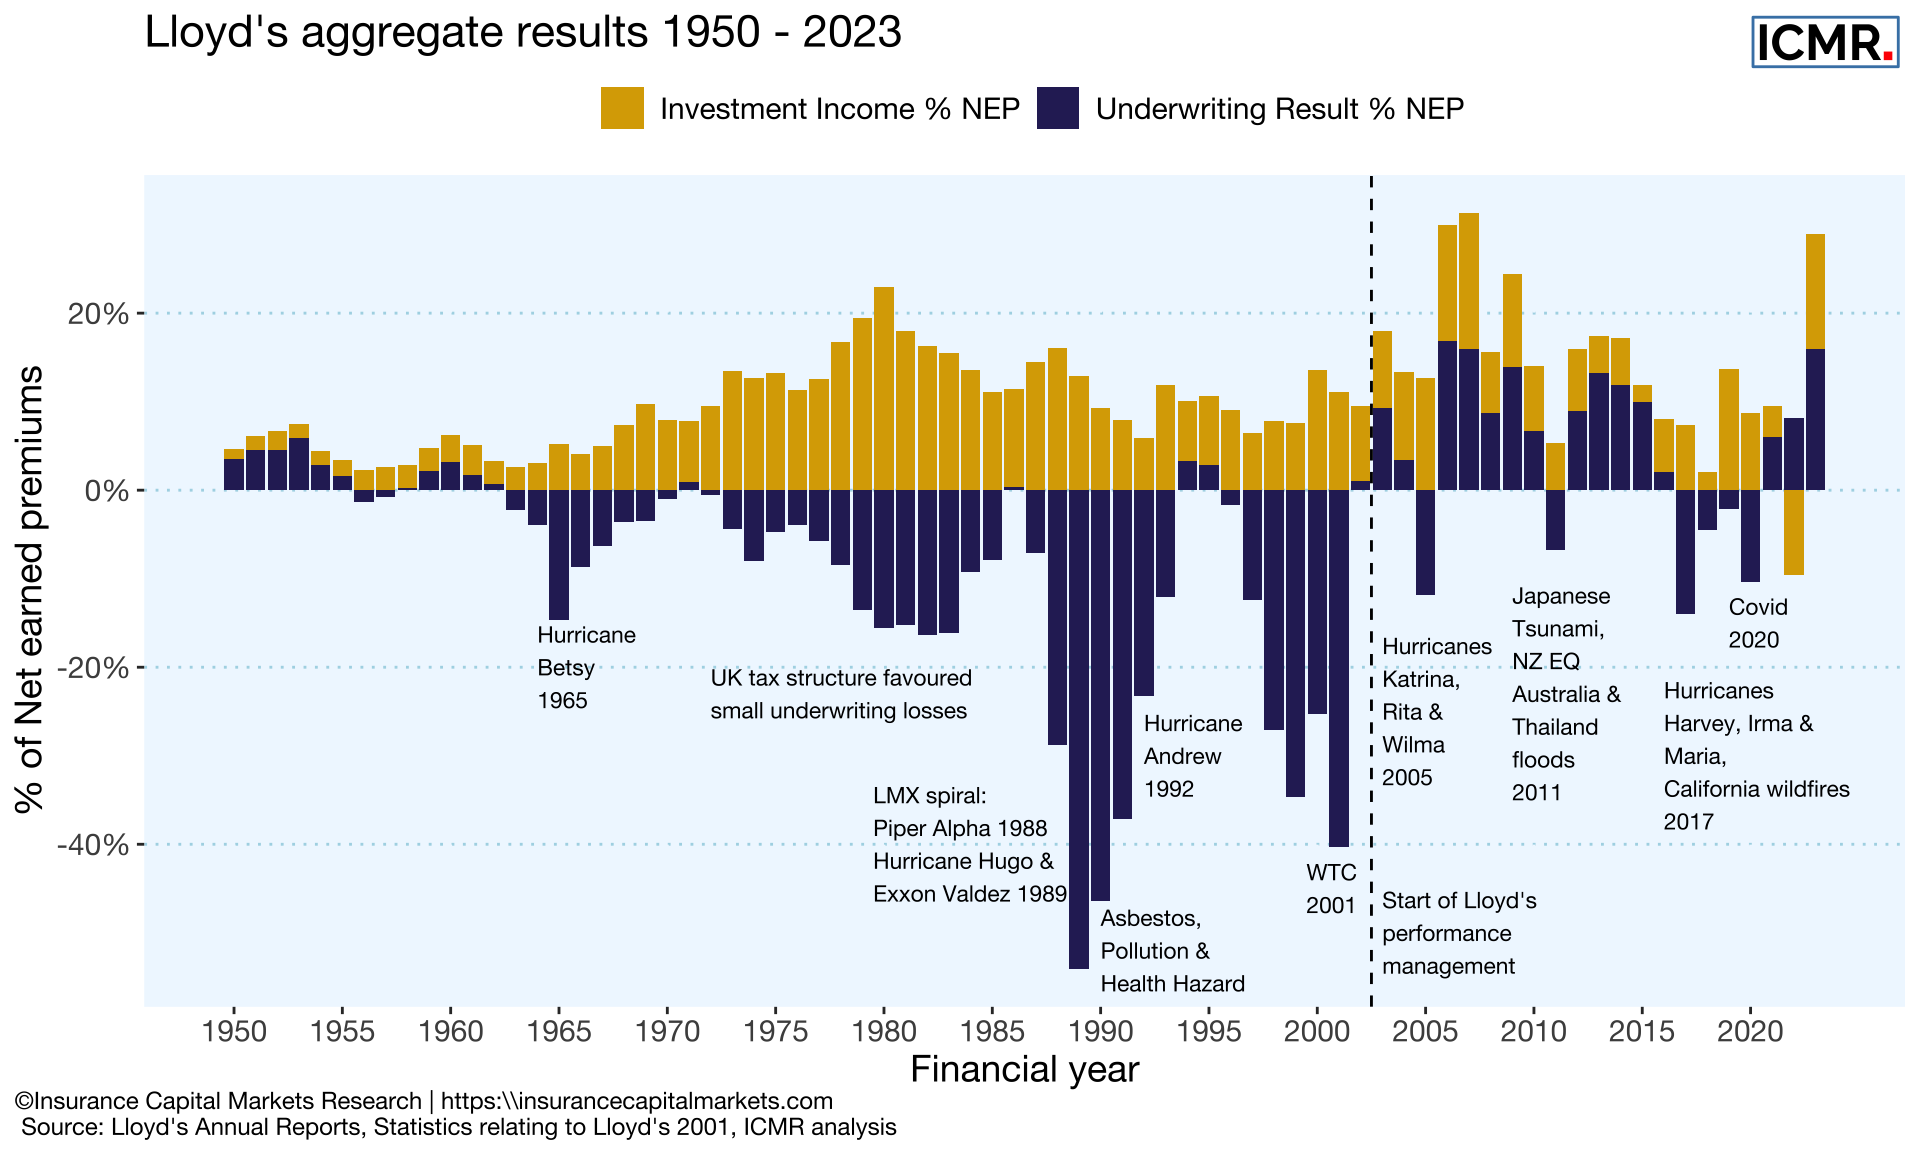
Syndicate investment return has been just over £14bn, varying as a percentage of net earned premium between -10% (2022) and 15% (2007). This compares with administrative expenses which were more than twice that cumulatively at £37bn, rising to a peak of 11.4% of net earned premium in 2015 before falling back to 8.8% in 2023.
Overall, investment in the Lloyd’s market has been positive in the aggregate, producing cumulative profits to investors of c.£40bn over the last 20 years. This represents an aggregate return on capital of 9.3%, or around 6.5% above risk free rate.
As shown by the blue bars representing underwriting results in Figure 2.3, the positive impact of performance management at Lloyd’s is very visible when looking across its long term history. There is a marked difference after the introduction of the central oversight function in 2003 as outlined in the Lloyd’s Chairman’s Strategy Group Consultation paper.
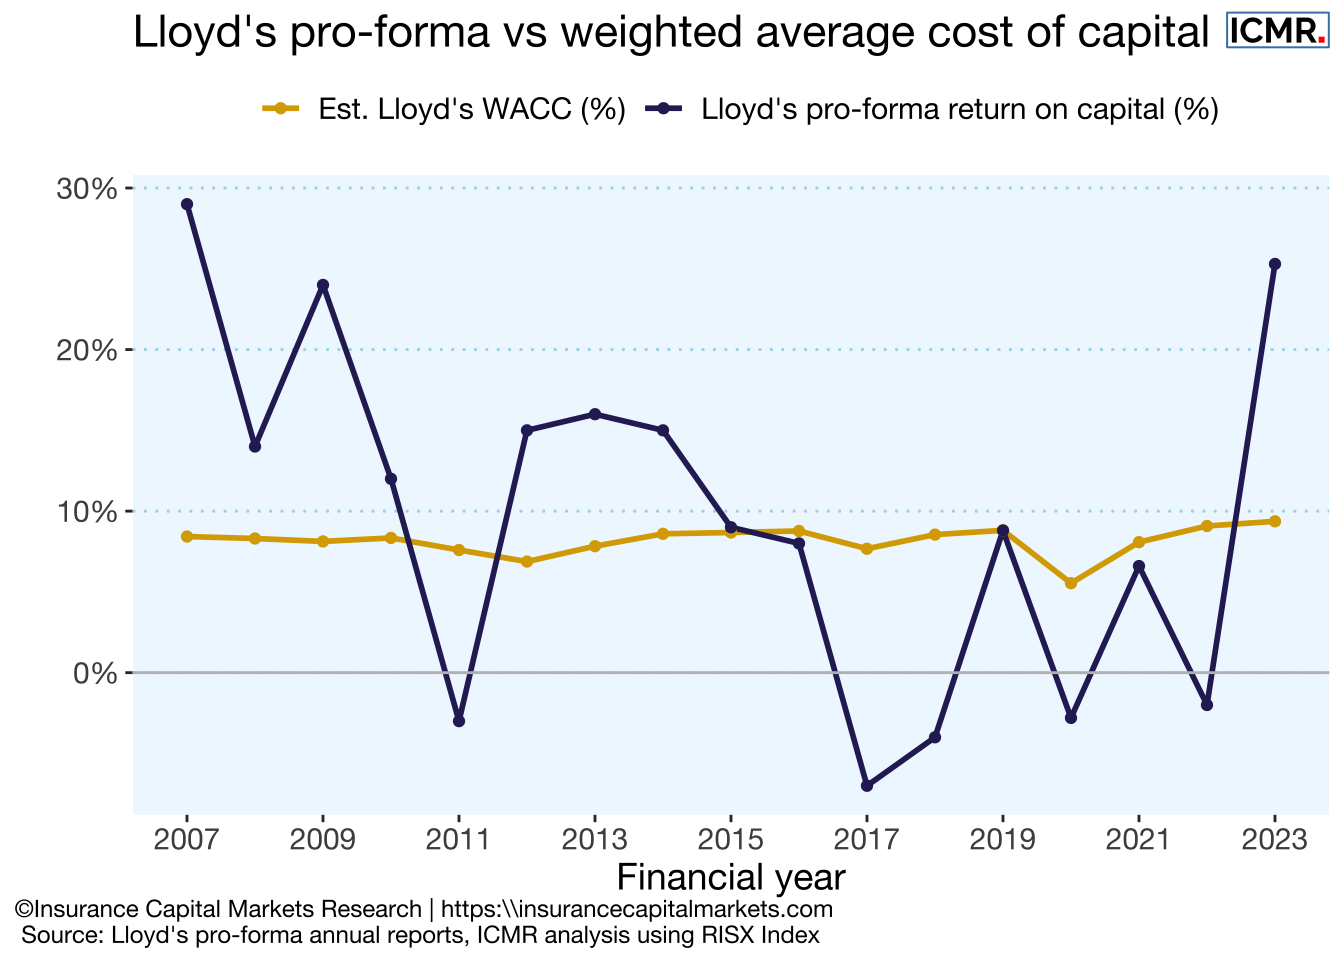
2.2 Lloyd’s exceeds cost of capital
In 2023 Lloyd’s has exceeded its weighted average cost of capital (WACC), something which the market as a whole has not delivered in nearly a decade.
2.3 Lloyd’s performance against other investments
Whilst Lloyd’s is a market, not a company, given it publishes its own discrete financial statements, the RISX index acts as a proxy for capital markets confidence and therefore is a benchmark for investor returns at Lloyd’s.
The RISX Index is an equity benchmark for the global specialty (re)insurance sector based on publicly listed companies with underwriting subsidiaries at Lloyd’s.
The RISX Index was developed by ICMR and is administered and calculated daily by Morningstar Indexes Ltd.
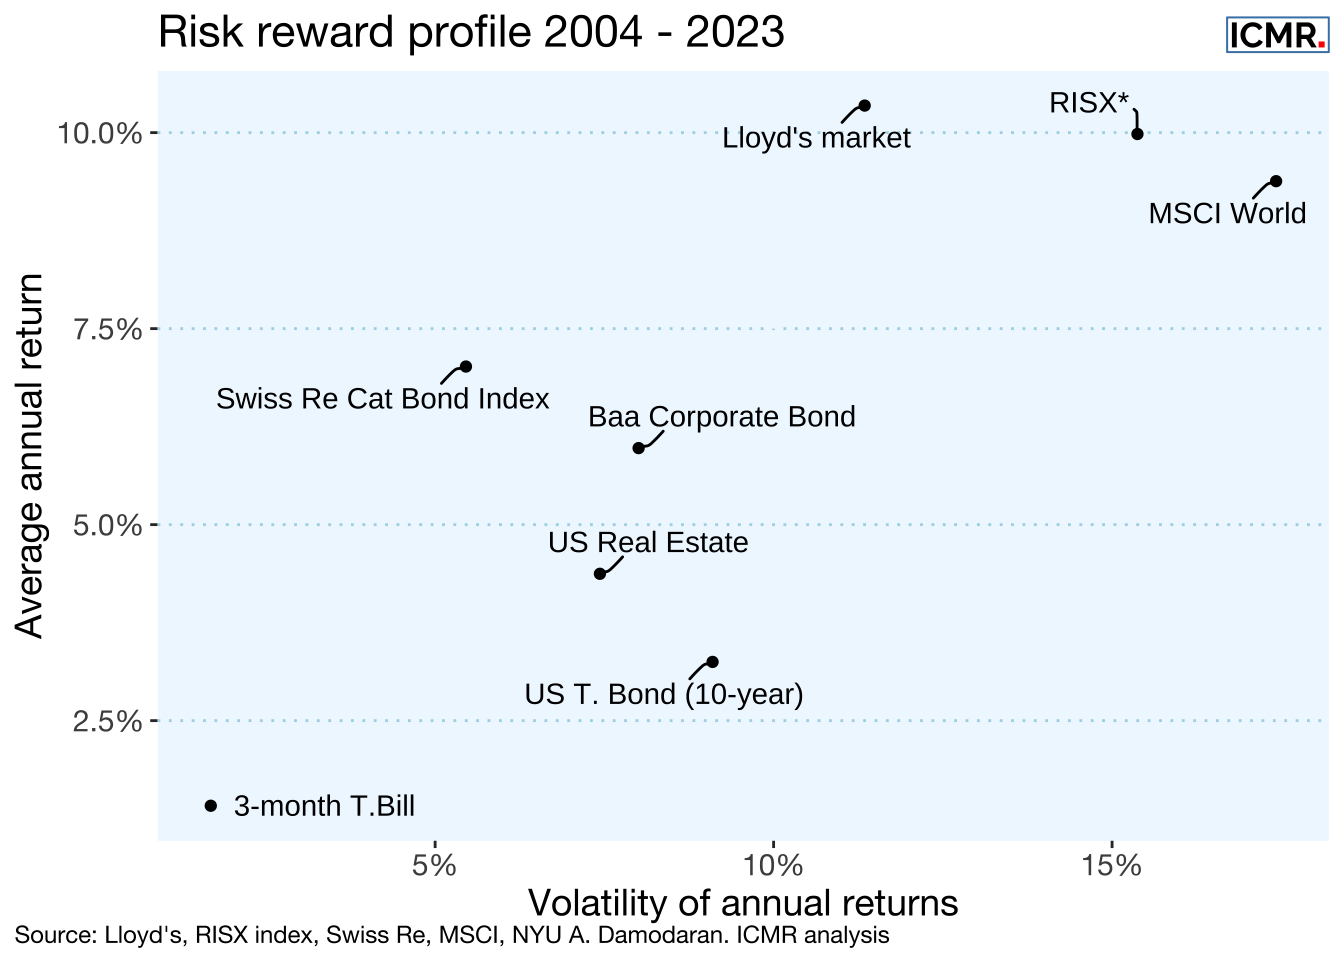
Lloyd’s returns on capital have traditionally compared favourably to Cat bond indices as well as other more mainstream investments. They have also, along with Cat bonds, shown lower correlation with those same mainstream investments represented by the MSCI World equity index.
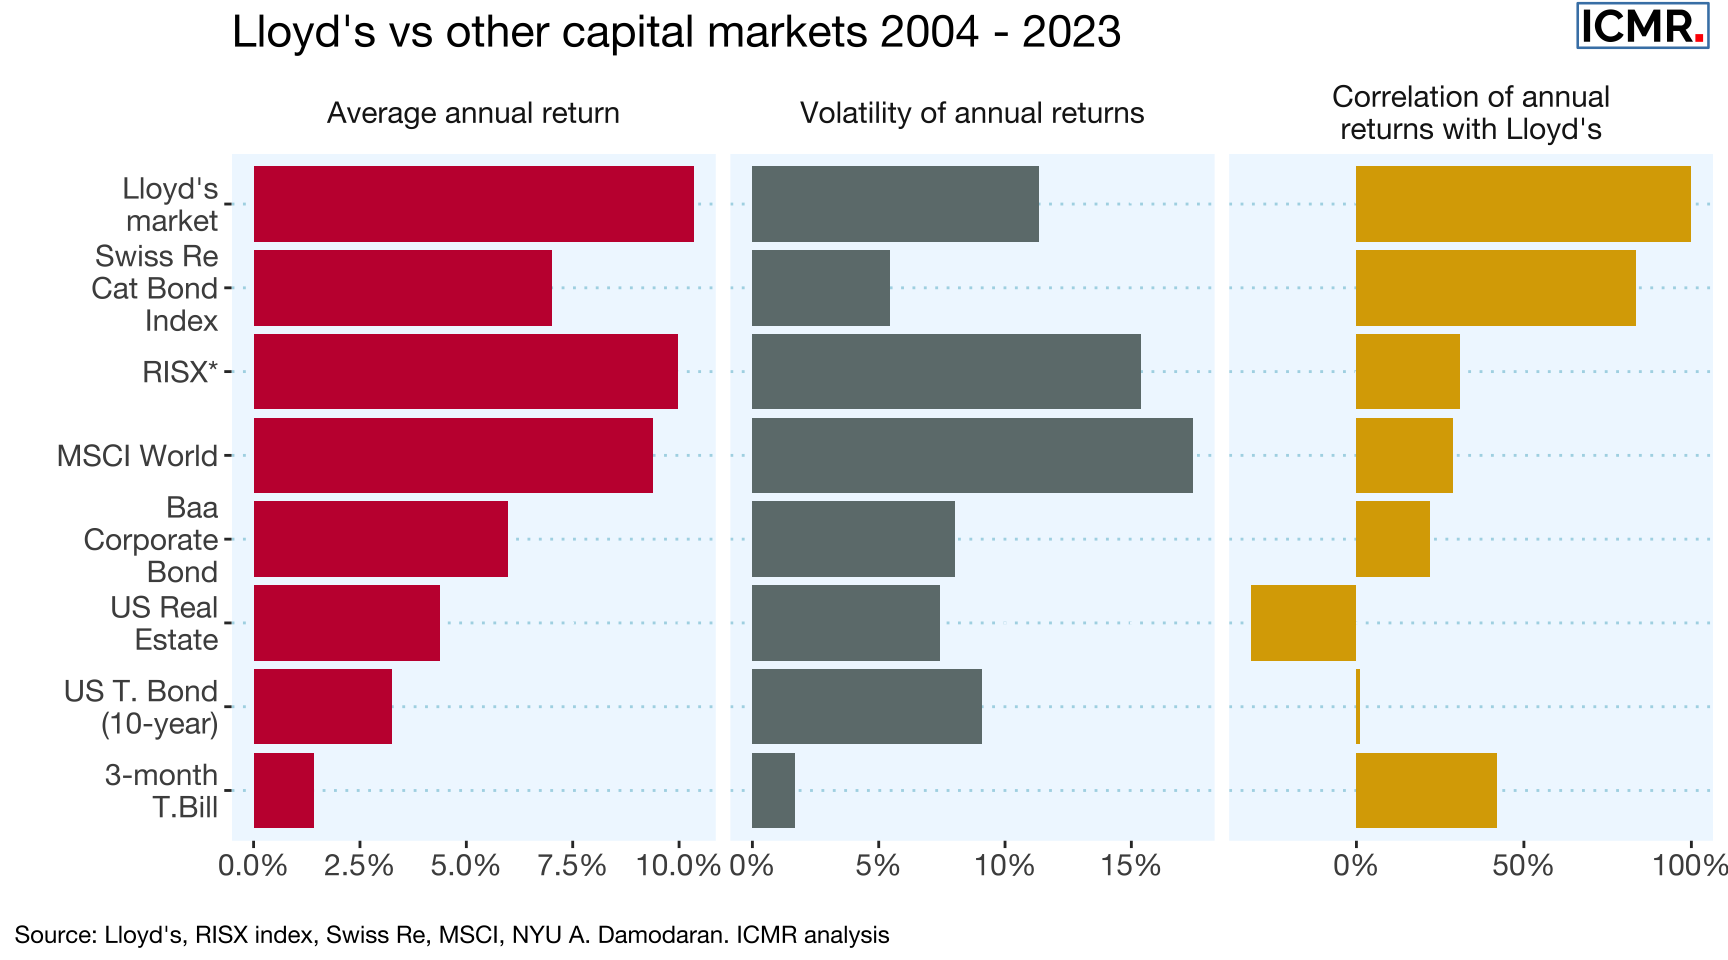
Lloyd’s overall market returns continue to show moderate volatility and low correlation with other asset classes and outperform Cat bond indices.
Whilst Lloyd’s 2023 results have been very positive, that’s not to say there are not strong headwinds coming. An improvement is only genuine if it can be sustained and that will include in major event years. With such low natural catastrophe activity in 2023, the resilience of the underwriting turnaround has not been fully tested, this is likely to change in 2024 with El Niño suggesting an active wind storm season in 2024.