3 Growth Analysis
Since 2015 the Lloyd’s market nearly doubled its premium income from £26,690m to £52,149m

3.1 What is driving this growth in premium?
In its annual analysts presentation, Lloyd’s provided details of how much of the change in annual premium income was due to risk adjusted rate change (RARC) and how much was due to movements in exchange rates (F/x).
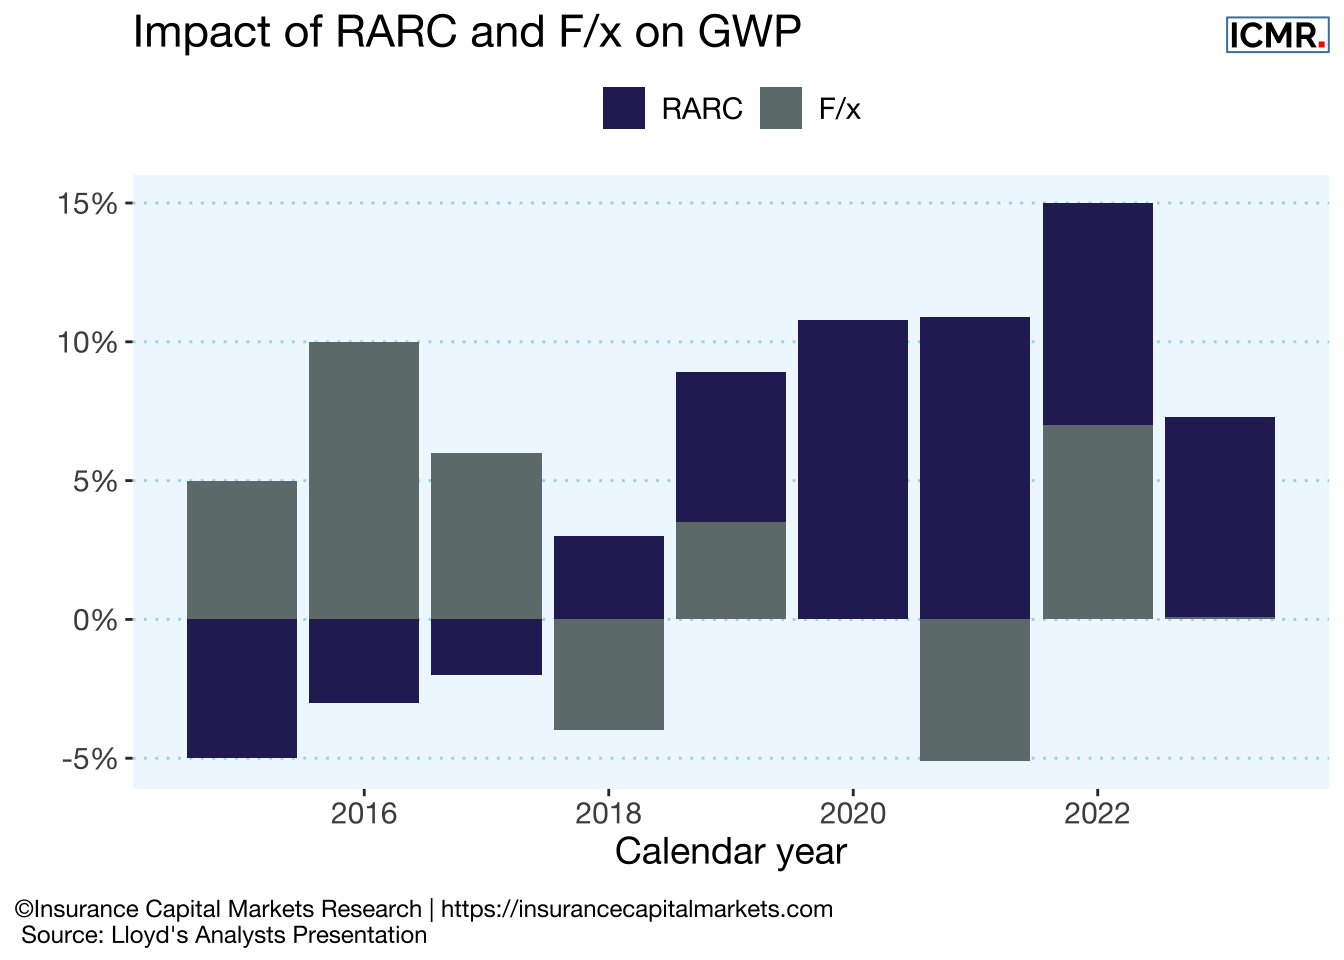
3.1.1 A more disciplined recovery
Combining these effects reveals a view of exposure growth included in market premium. This shows the effect of the remediation period from 2018 to 2021 and the acceleration of exposure growth in 2022 and 2023 in a firmer rating environment. Although RARC is only applicable to renewal business, which makes up c.70% of premium, we believe it is indicative for overall risk adjusted price changes.
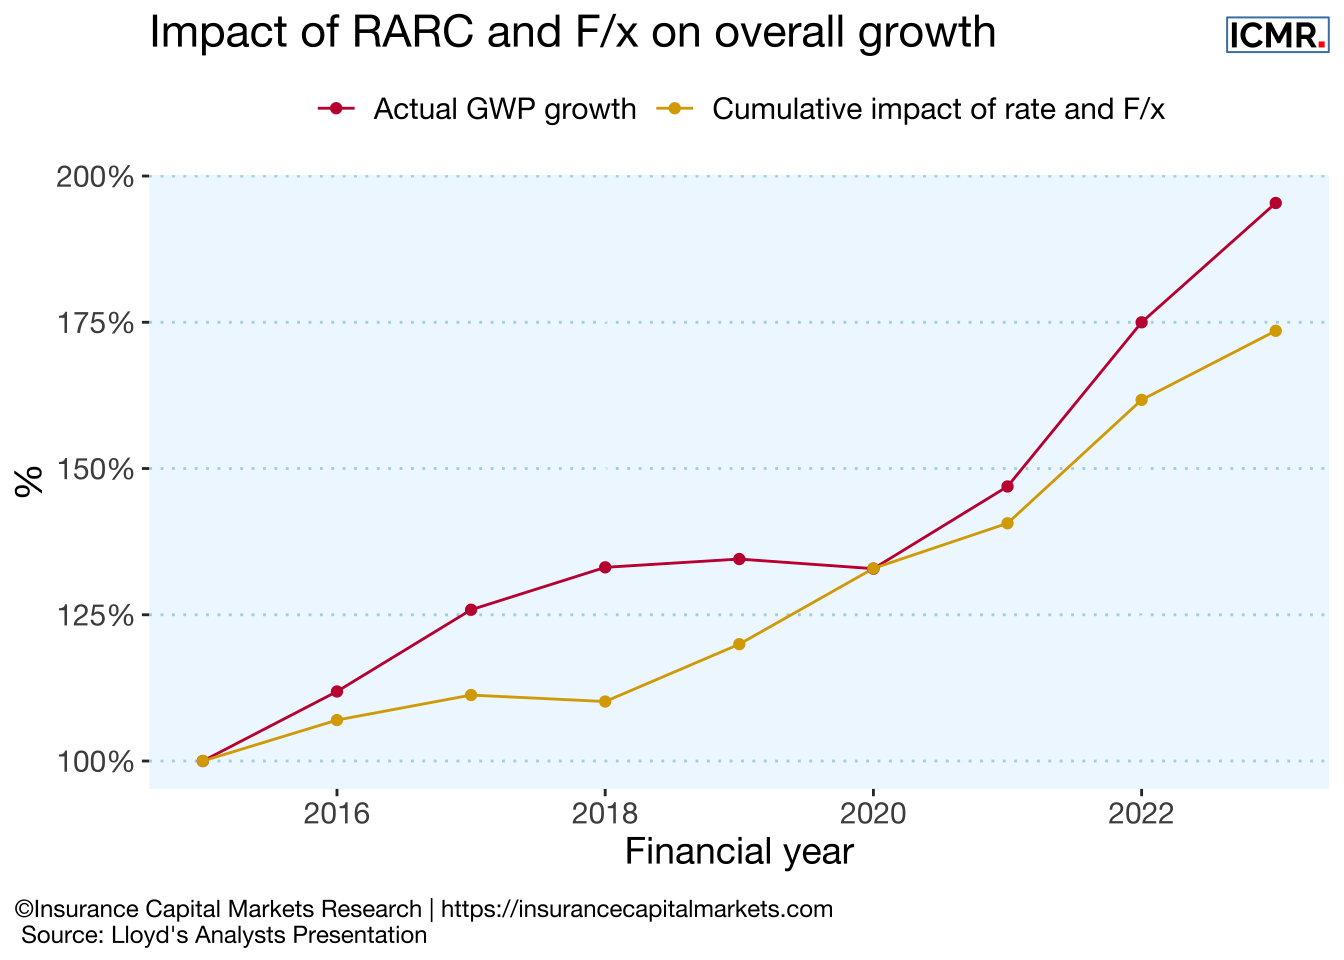
Most of the market’s premium growth has arisen from improvements in underlying rate change in combination with exchange rates, suggesting a disciplined approach to premium growth. This also implies that the performance management effort in Lloyd’s and market firms is delivering on its mission.
3.2 Syndicate growth analysis
The total number of syndicates changes every year with market dynamics. The current syndicates are listed in the Appendix.
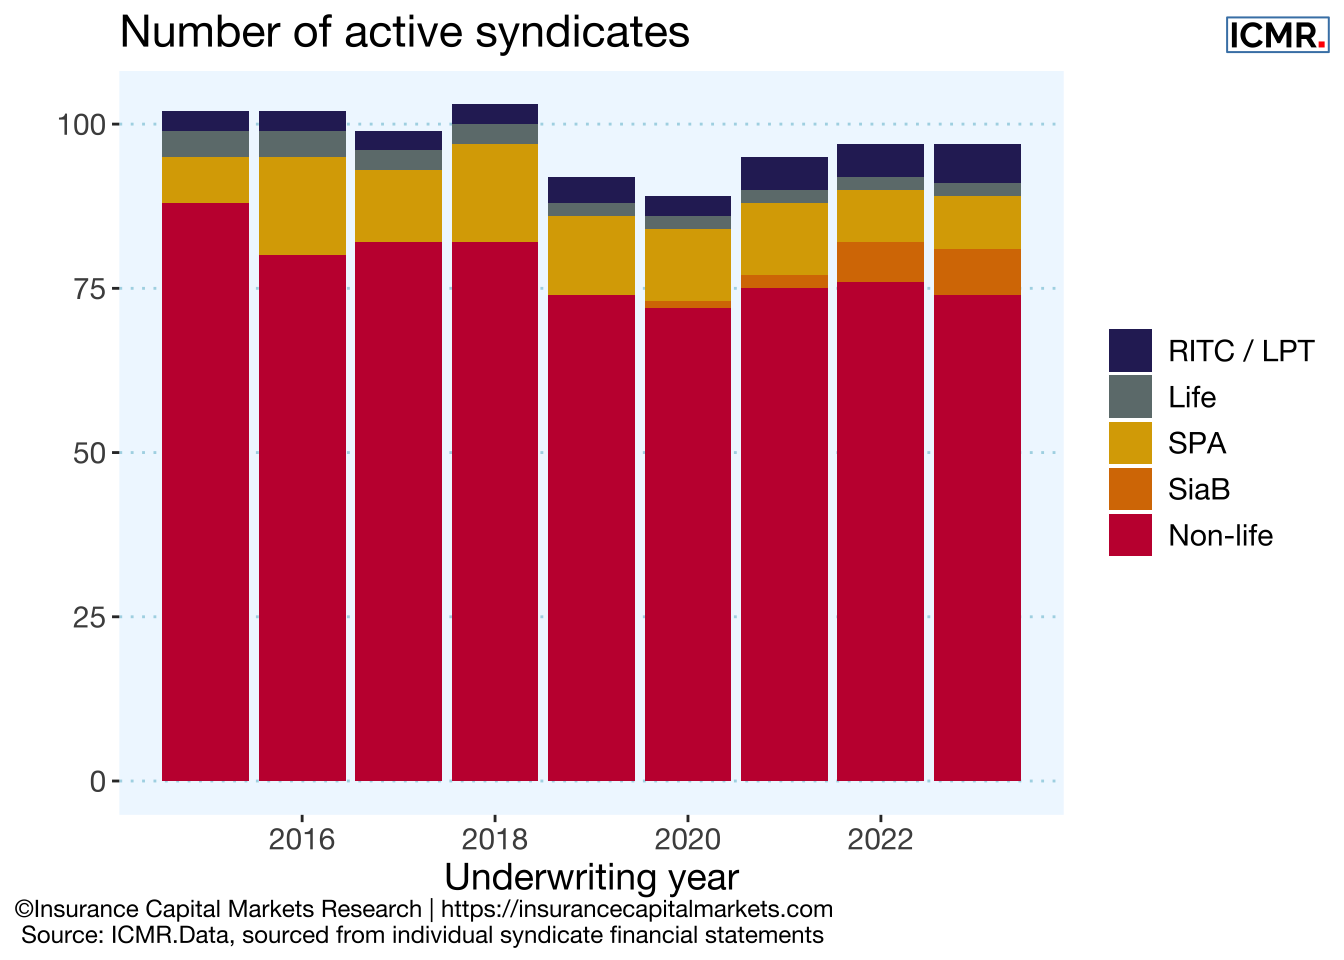
This dynamic has been aided by Lloyd’s Blueprint initiatives, particularly regarding the syndicate in a box (SiaB) initiative, where ideas can be tested in the market without committing to full syndicate costs.
Although the number of syndicates has stayed close to 100 over the past decade, there have been a number of movements in the market. SiaB is now an established route for new ideas to start at Lloyd’s, as are special purpose arrangements (SPAs) alongside reinsurance to close (RITC) and legacy writers. Indeed, during 2023 12 legacy transactions took place, including converting existing loss portfolio transfers (LPT) into RITCs. This partly reflects remediation activity, but also the use of this important mechanism by firms to release capital to support growth in a harder market.
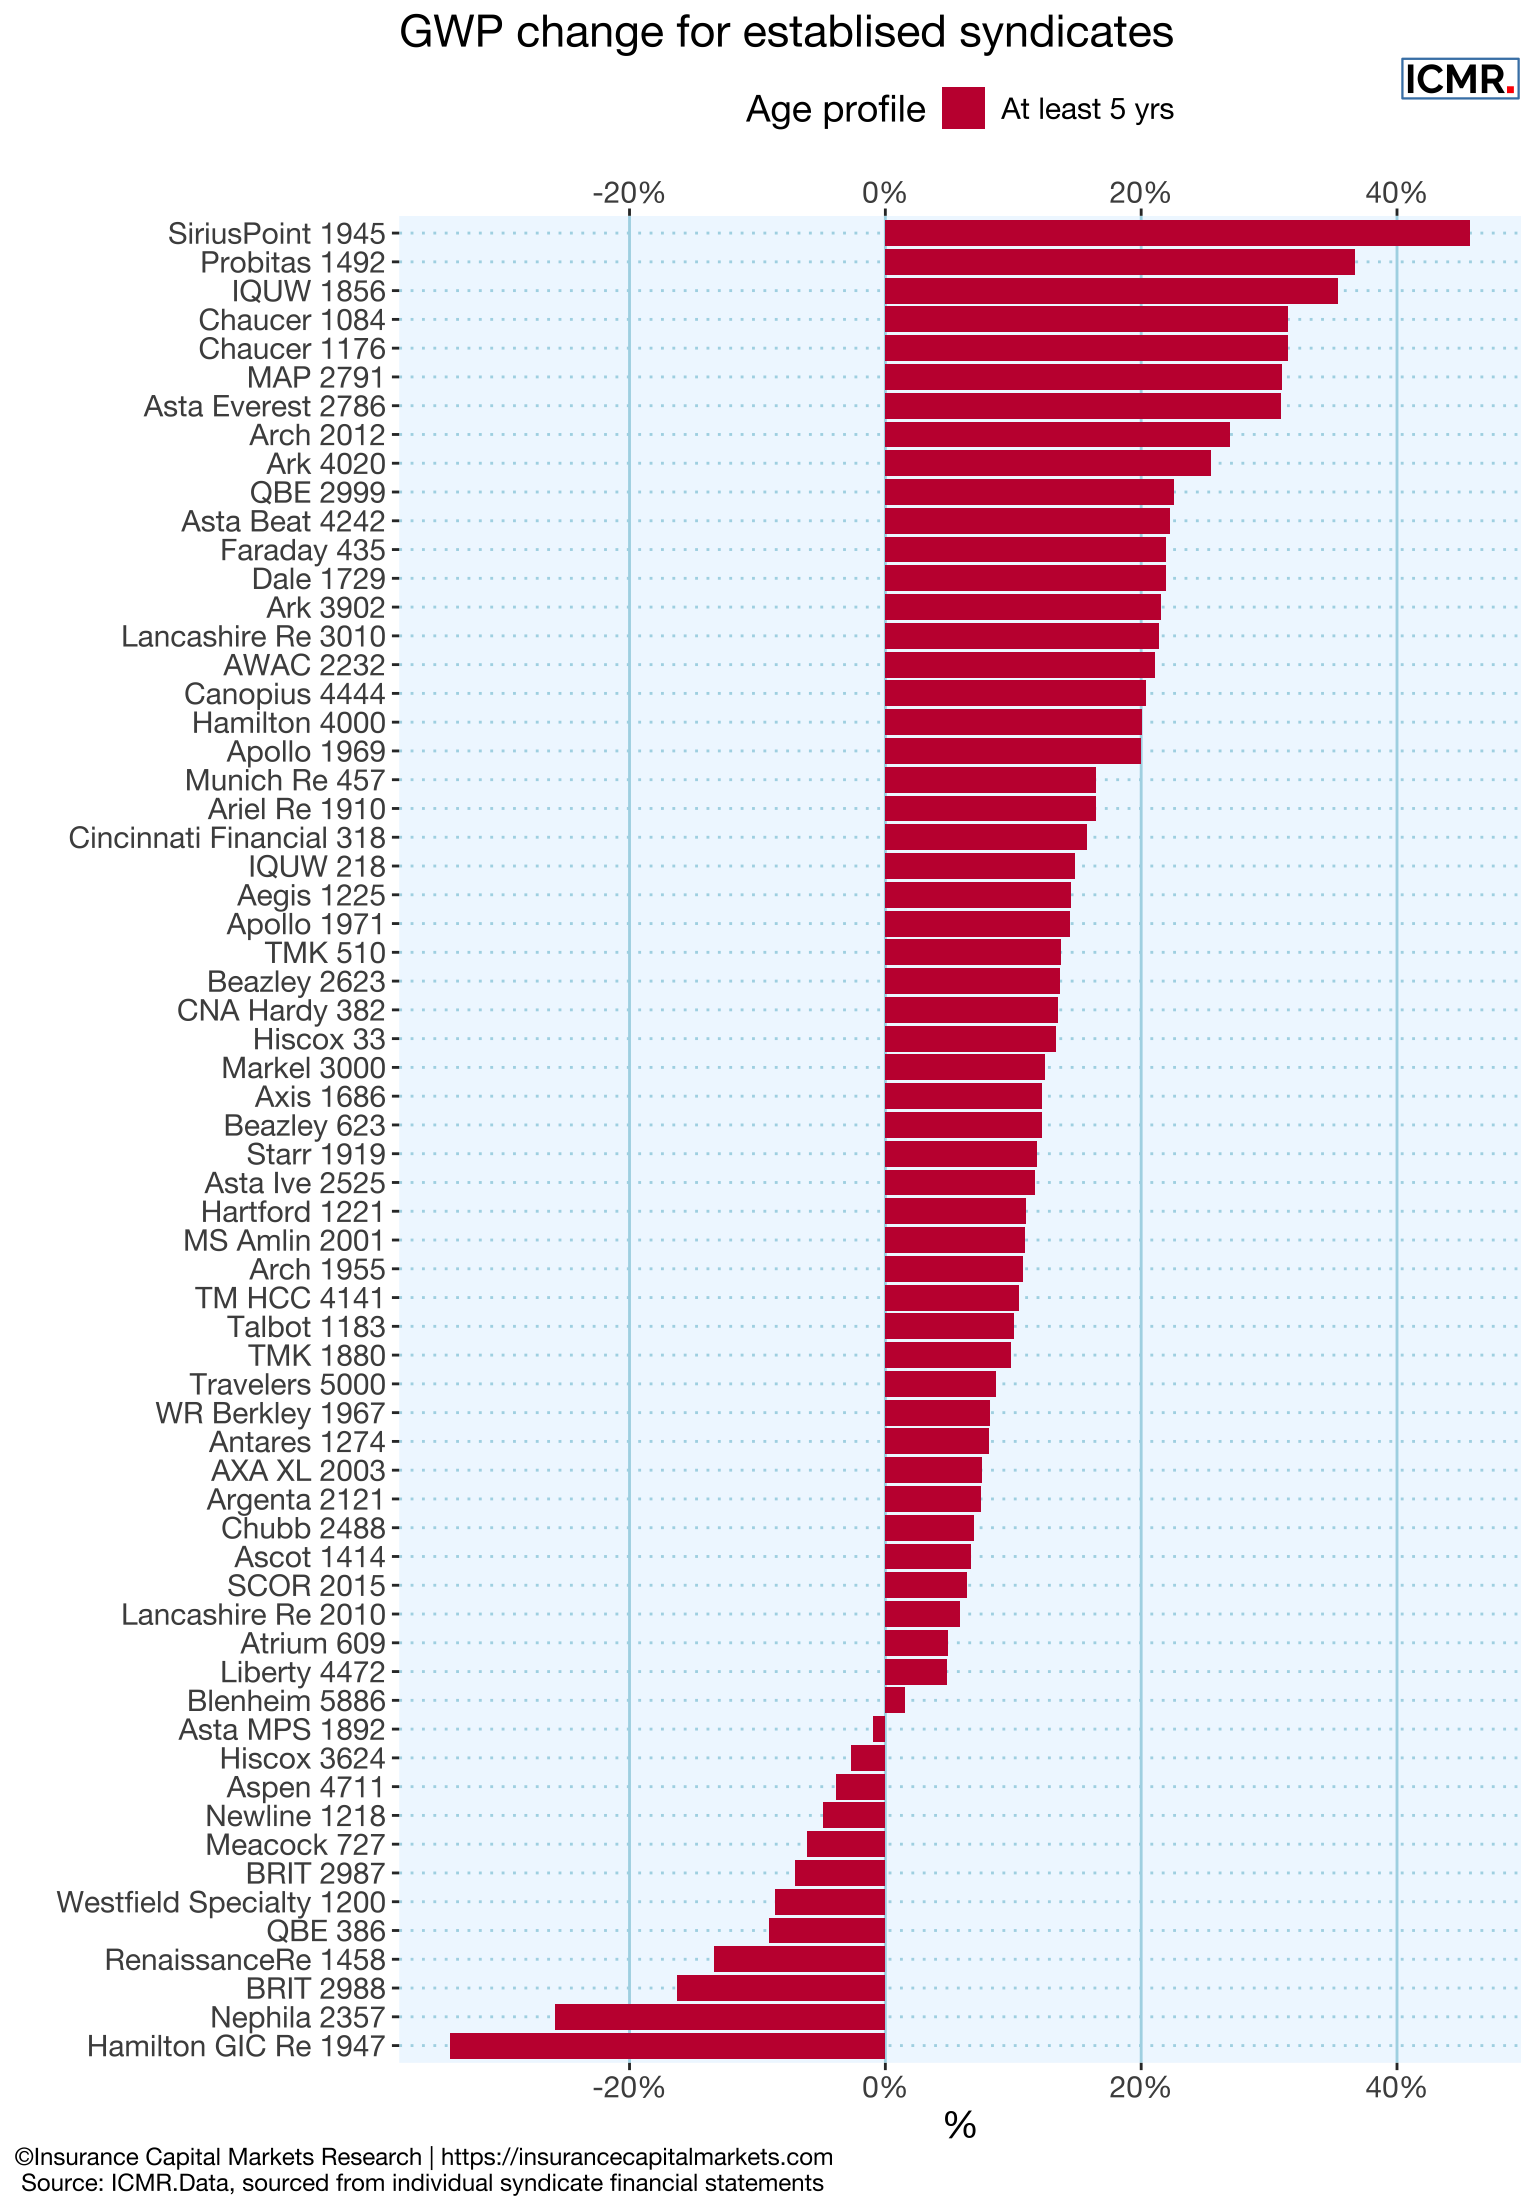
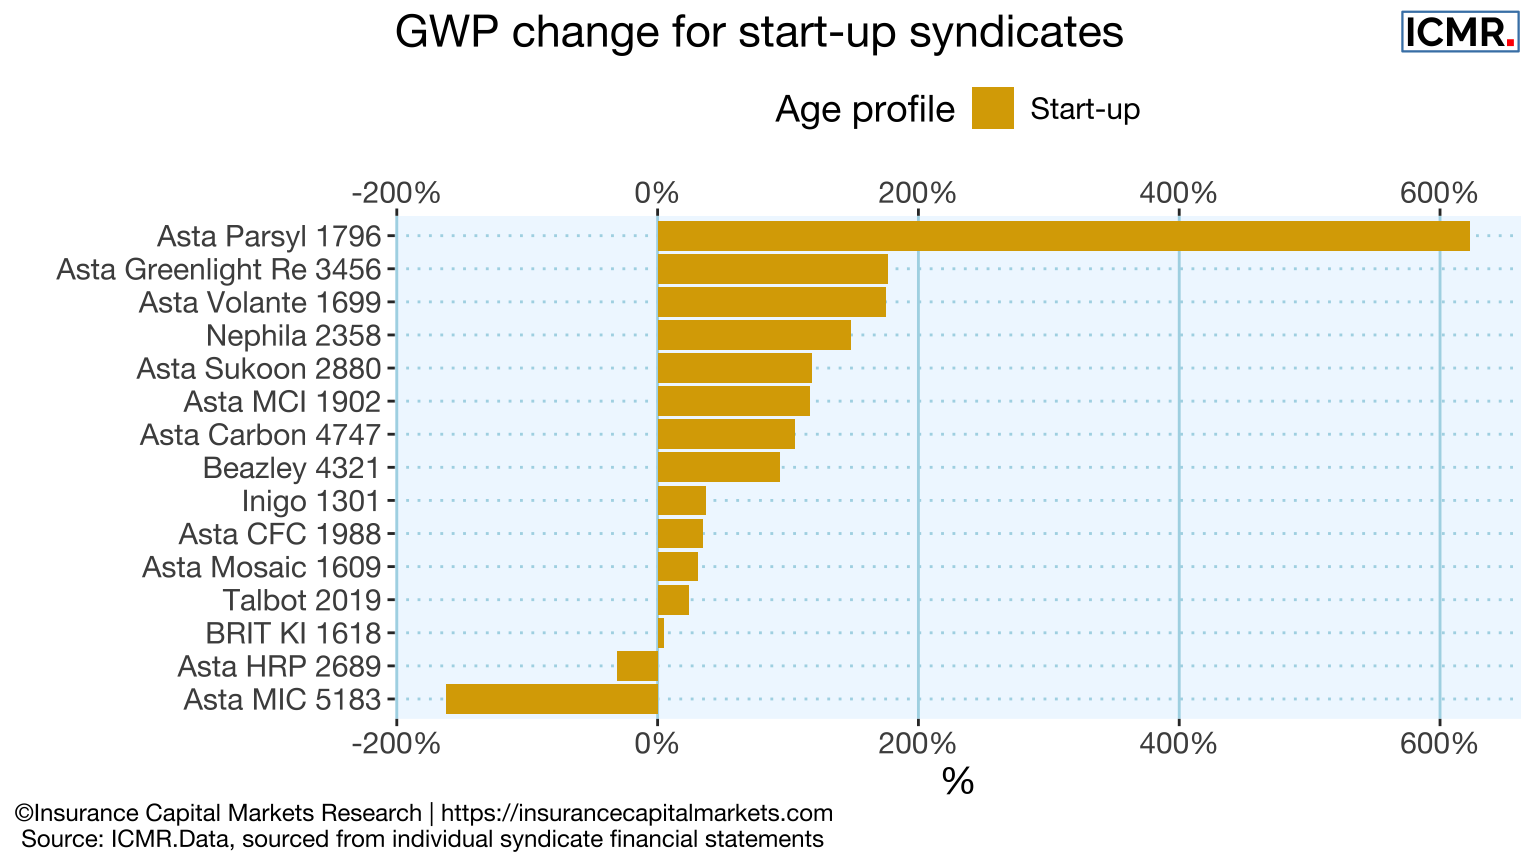
The following tables show the number of syndicates by GWP bandings as well as by age profile, demonstrating the importance of new syndicates reaching scale within 3-5 years.
Number of non-life syndicates by GWP category over time
Number of non-life syndicates by age profile in 2023
| Syndicate age | Under £200m | £200 - £500m | £500m - £1bn | £1bn - £2.5bn | Over £2.5bn |
|---|---|---|---|---|---|
| Less than 5 year | 6 | 2 | 3 | NA | NA |
| Less than 10 year | 2 | 7 | 1 | NA | NA |
| Older than 10 years | 5 | 19 | 16 | 14 | 1 |
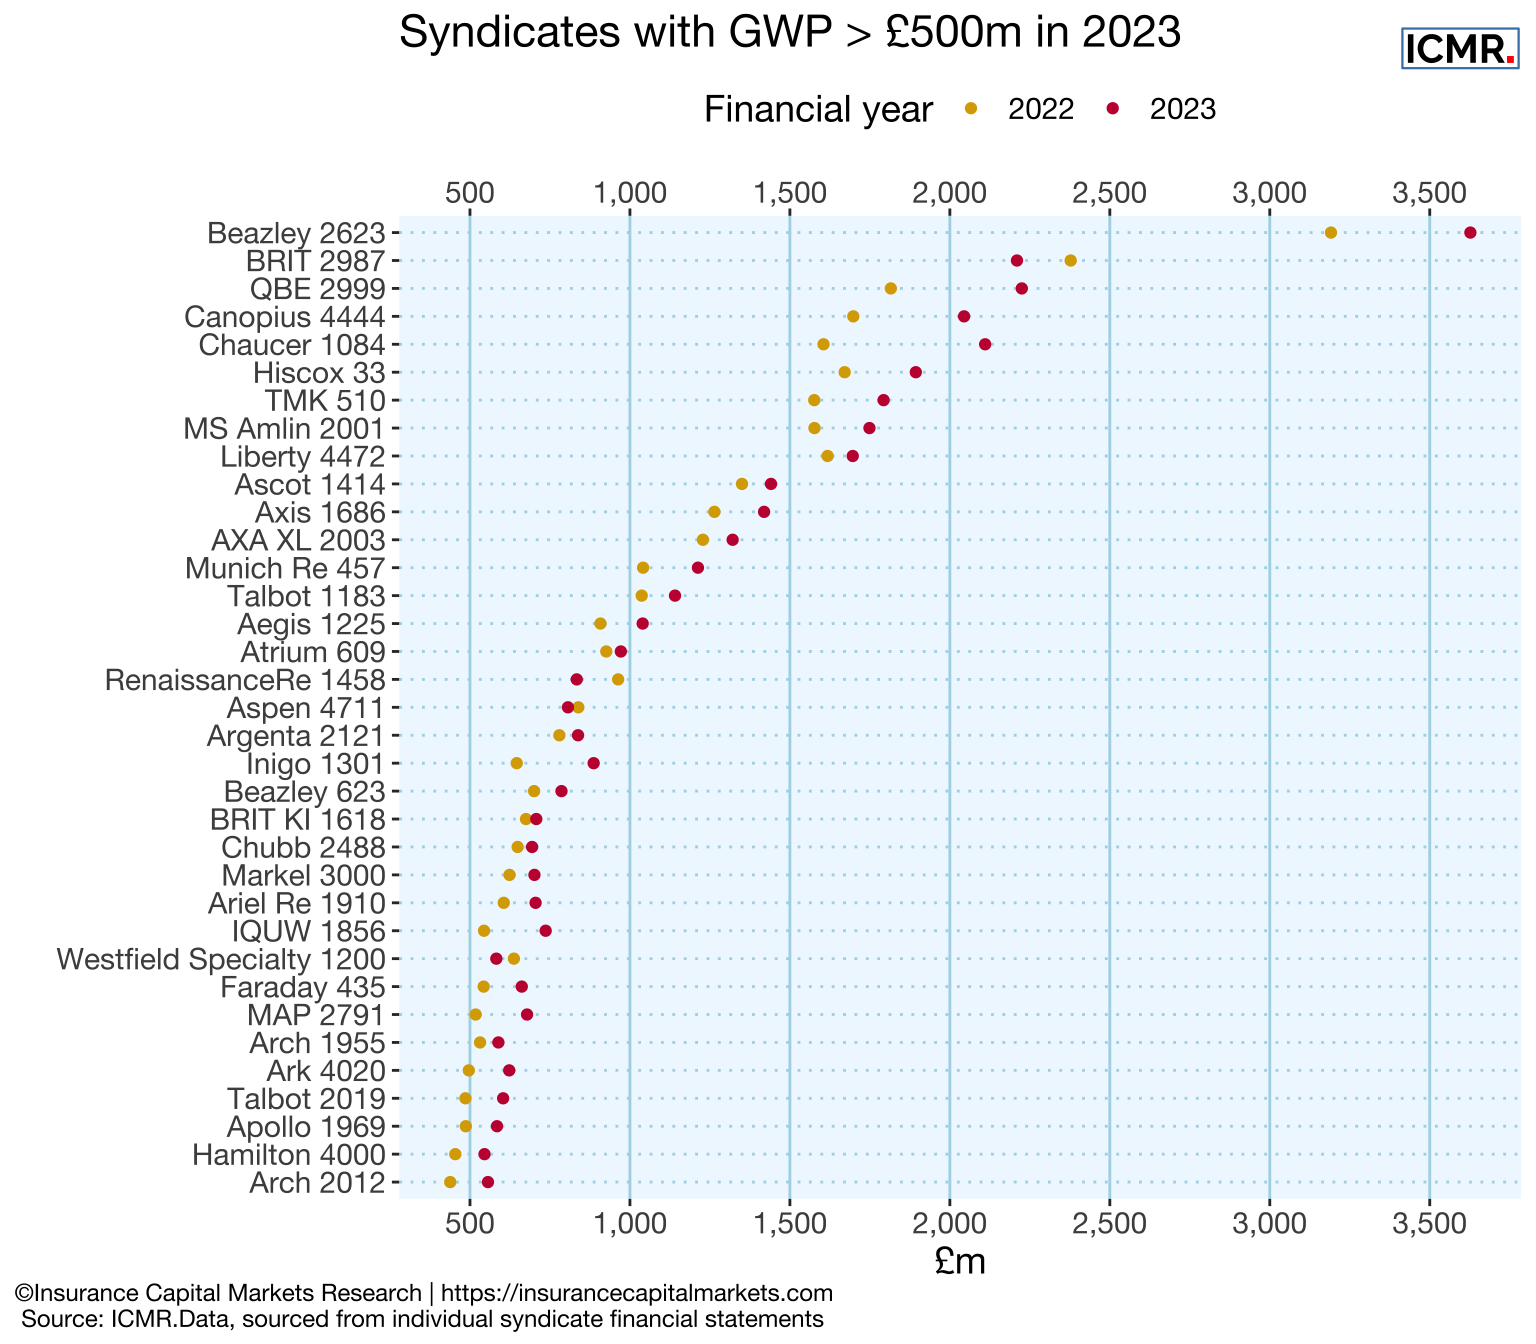
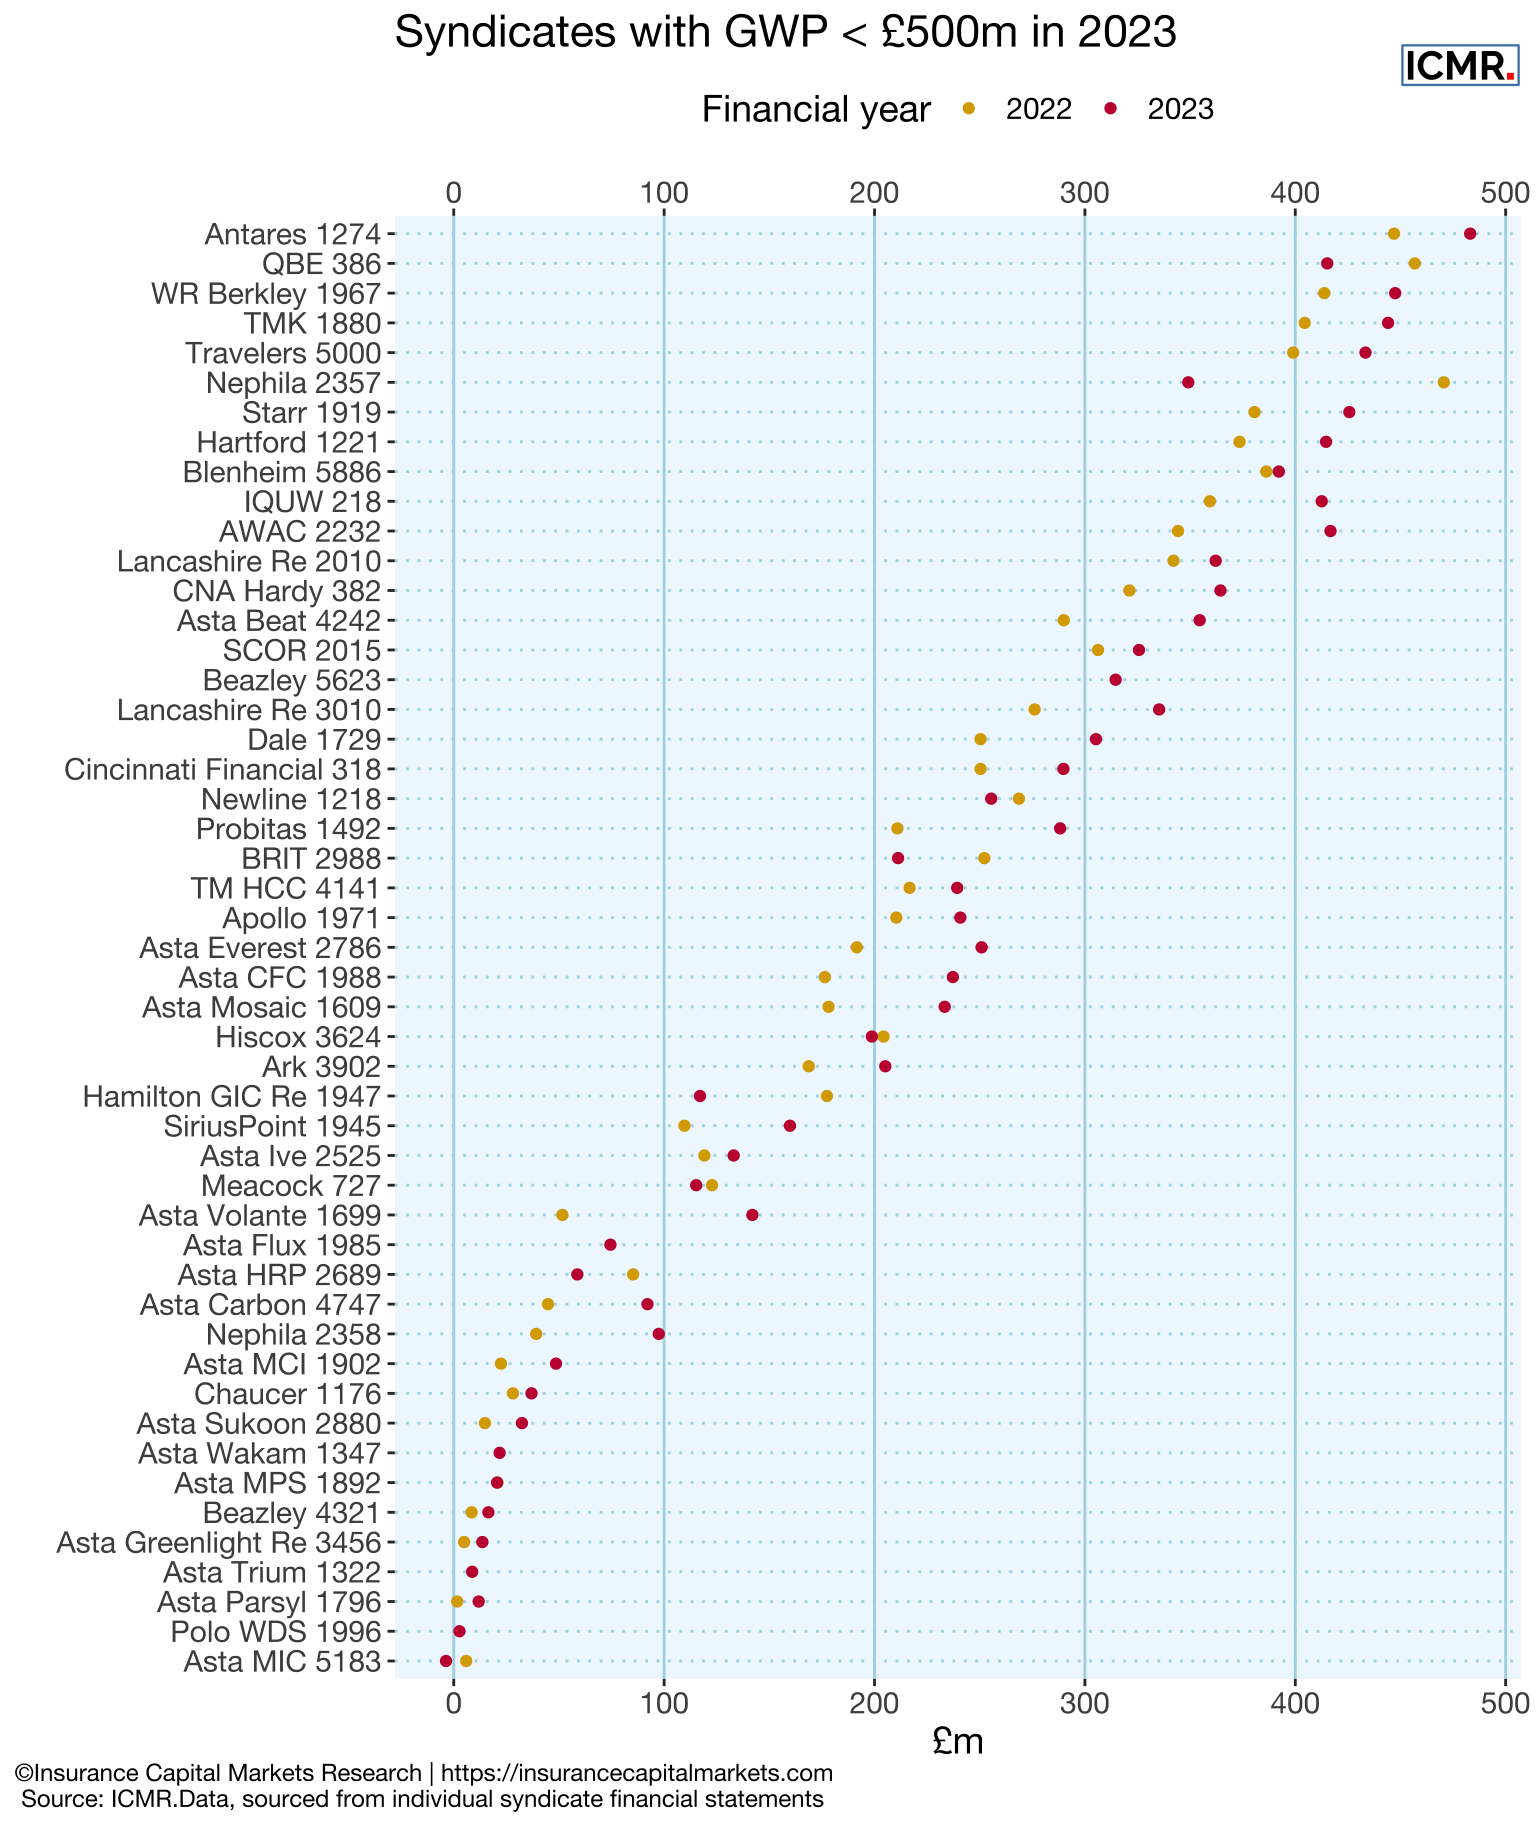
3.3 Premium growth
The following chart gives a more detailed view of syndicates’ GWP evolution over the last two years.