8 Valuation and Value Creation
Although Lloyd’s does publish pro-forma accounts to represent what the market performance would look like, if it were a company, many other aspects of a publicly listed company are missing, particularly around value creation from a capital markets perspective.
8.1 A capital markets proxy for Lloyd’s
ICMR created the RISX equity index, as an investment benchmark for the (re)insurance specialty industry with a particular focus on investment at Lloyd’s.
Top 10 RISX constituents
The index is based on the publicly listed global carriers who own managing agencies within the Lloyd’s market and who currently control over two thirds of Lloyd’s premium and capital. The companies have then been weighted to reflect Lloyd’s aggregate risk profile such that the index weighted combined ratios and returns on capital mimic those of the Lloyd’s market as a whole.
In this way the RISX equity index provides a relevant, real time, liquid comparative for capital markets’ views on Lloyd’s aggregate performance. More information on the index can be found at https://risxindex.com.
Using parameters derived from this index of listed companies allows for outside-in valuation analysis of unlisted illiquid entities such as Lloyd’s syndicates.
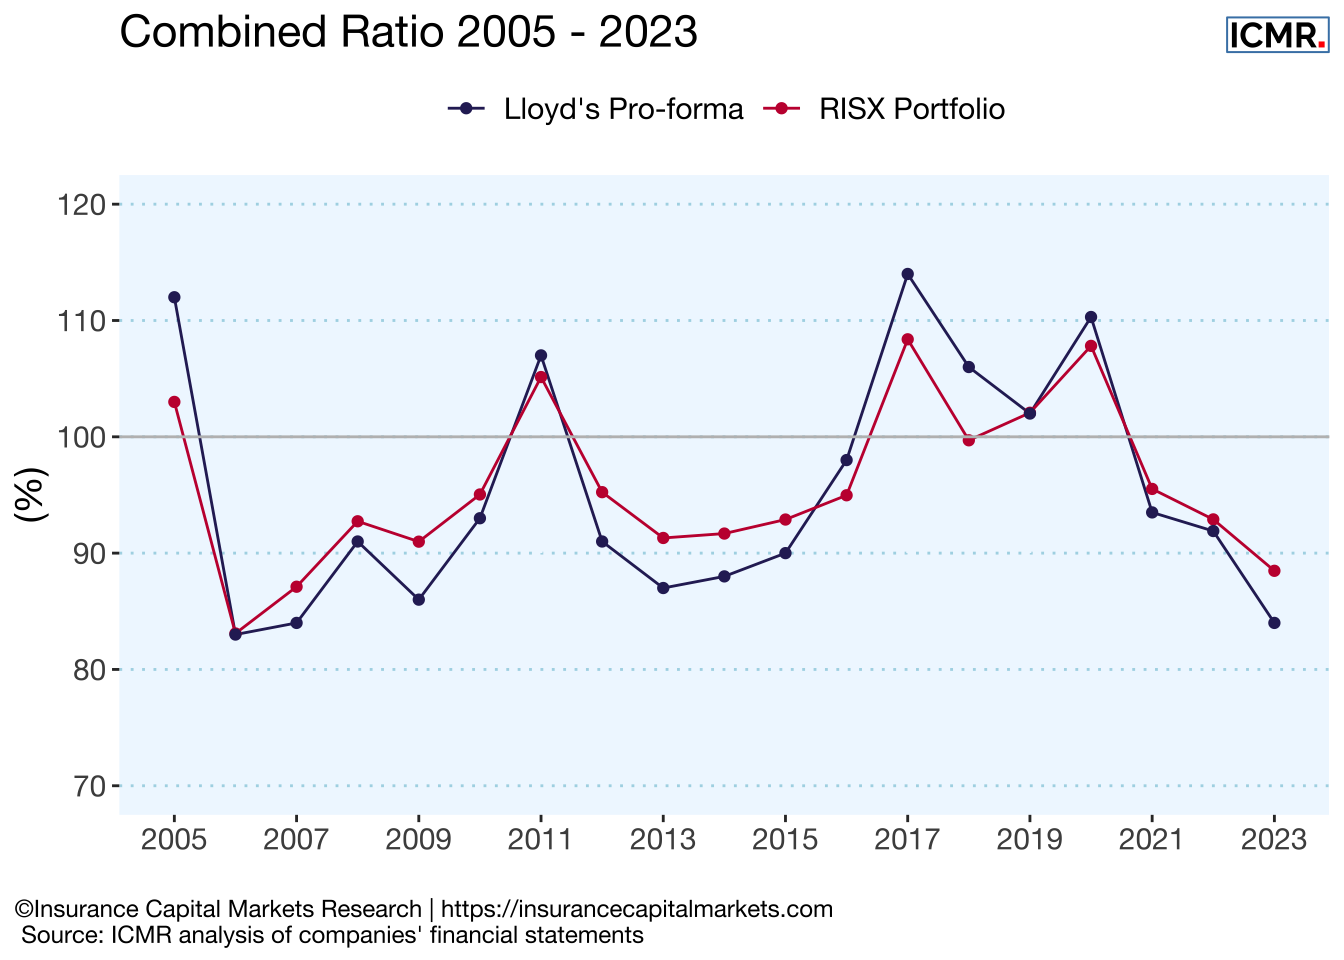
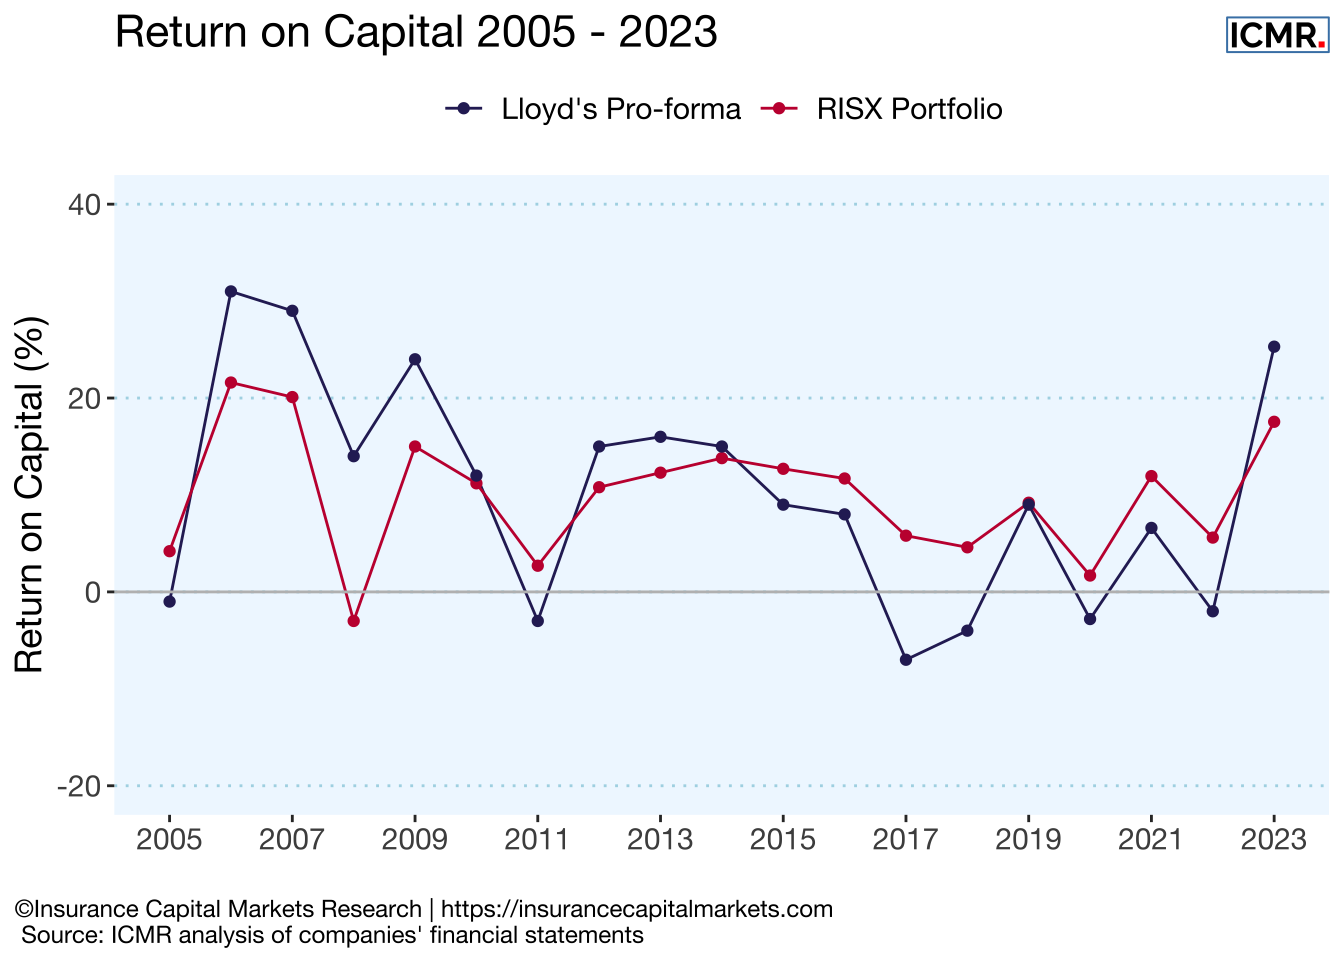
The following two charts demonstrate the closeness in performance of the premium weighted RISX portfolio and Lloyd’s pro-forma results. Lloyd’s results tend to be slightly more volatile but with better results in years with benign major loss activity.
8.2 RISX performance
Given the closeness in the performance of the RISX portfolio to Lloyd’s pro-forma, the aggregate of the share price movement of the underlying RISX constituents provides a proxy for the “share price” movement for Lloyd’s, as if it were a publicly listed company.
Unlike Lloyd’s pro-forma return on capital, the RISX performance is a real investment benchmark, since the underlying assets are publicly traded equities. An investor can replicate the RISX index by buying publicly traded shares, whereas it is not possible to replicate Lloyd’s pro-forma returns on capital.
The RISX factsheet gives more details of the performance.
8.3 Price to book multiple
Using the RISX constituents weights allows us not only to aggregate share prices and other metrics such as combined ratio and return on equity, but also valuation metrics such as price to book, to proxy the value creation at Lloyd’s.
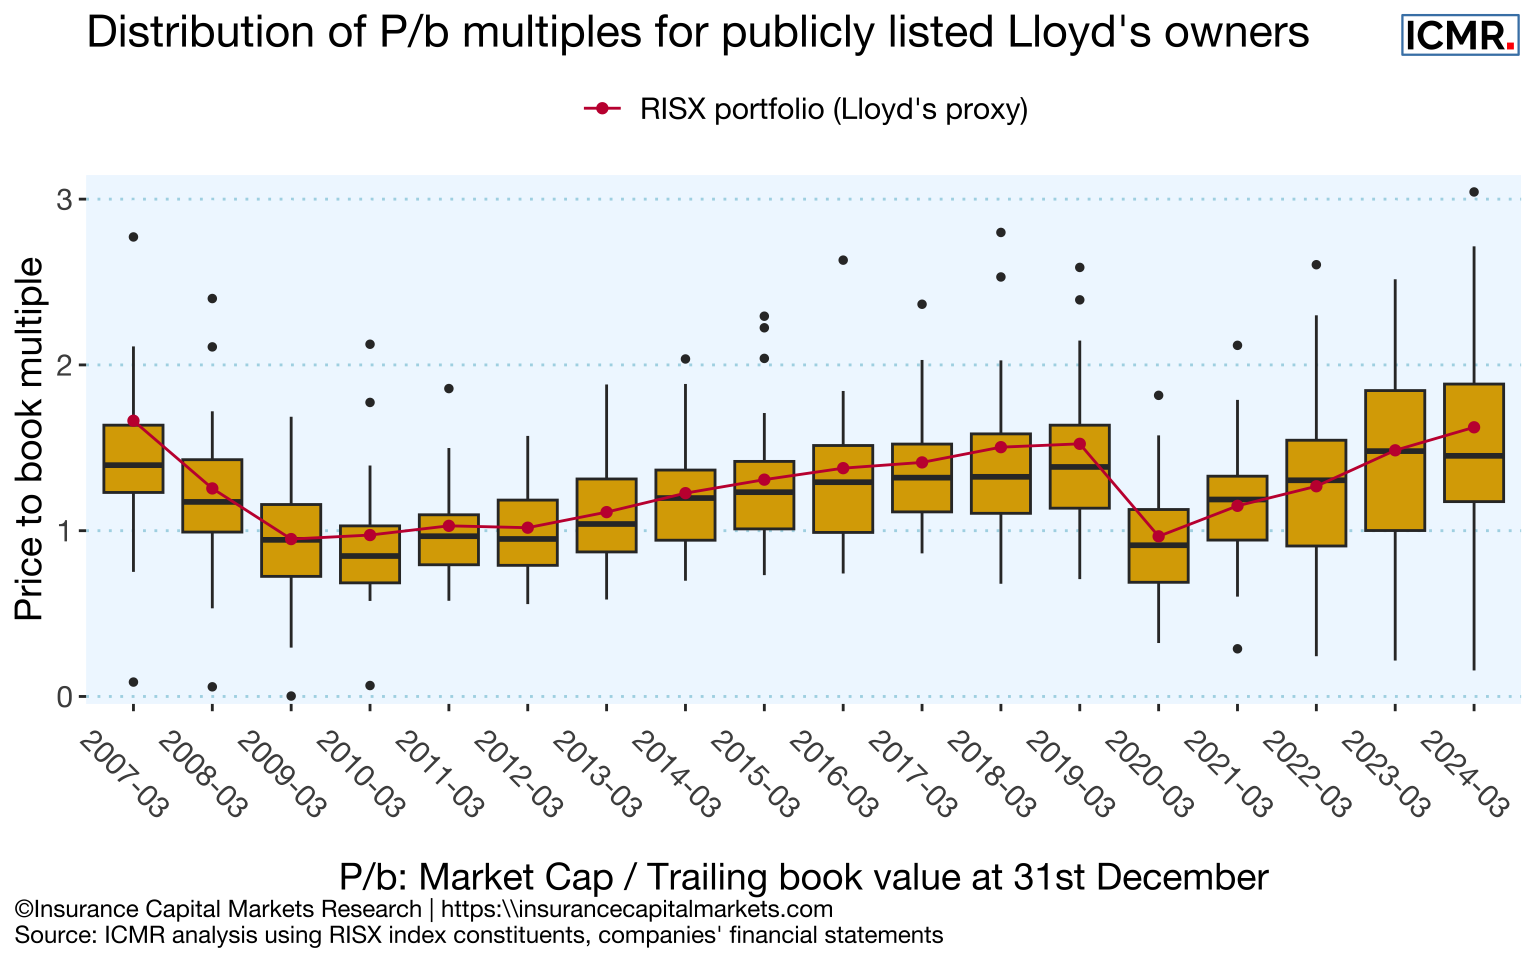
The above chart shows a box-whisker plot of the distribution of market capitalisation to trailing book value (P/b) for the between 25 & 40 listed global carriers which have historically owned and controlled syndicates at Lloyd’s. Their cumulative balance sheet shareholders’ equity currently amounts to over USD 1.0Trn (including Berkshire Hathaway with USD 561bn) and their global net premium amounts to c.USD 566bn.
As an industry, we are back to pre-Covid valuation levels. Share prices have been growing significantly in 2024, so the apparent dip shown in the median may result from even faster strengthening balance sheets being reported as at 31/12/2023.
8.4 Valuation of syndicates
Recent performance has been accelerating, showing capital markets pricing-in the very favourable returns being announced.
Relating this price to book value information to Lloyd’s syndicates reveals the following hypothetical valuations of individual syndicates. (NB - this assumes every syndicate is a discrete integrated Lloyd’s vehicle (ILV) with no capital diversification benefit between syndicates; it is based on ICMR outside-in modelling of every syndicate’s ECA requirement).
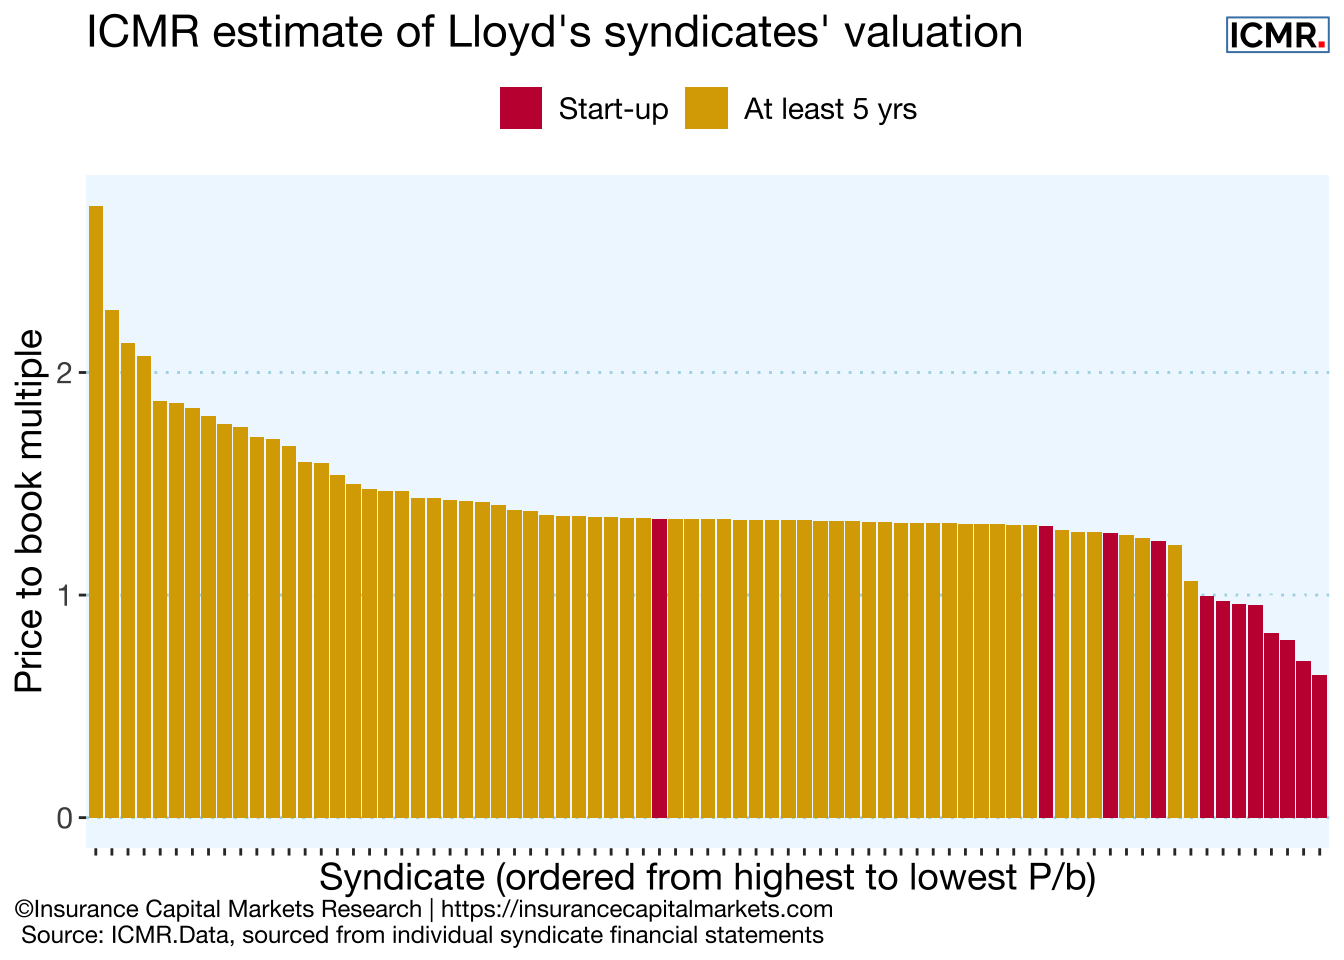
Current public market pricing suggests virtually all syndicates have at least created hypothetical value for their owners, bearing in mind the largest syndicates would not always have the highest P/b multiples. There are still some clear under performers, though these are usually start ups in their initial phases, with additional capital loads and costs.
The journey from under performer to out performer can be illustrated through the following quadrant diagram.
8.5 ICMR.Matrix: The journey to value creator
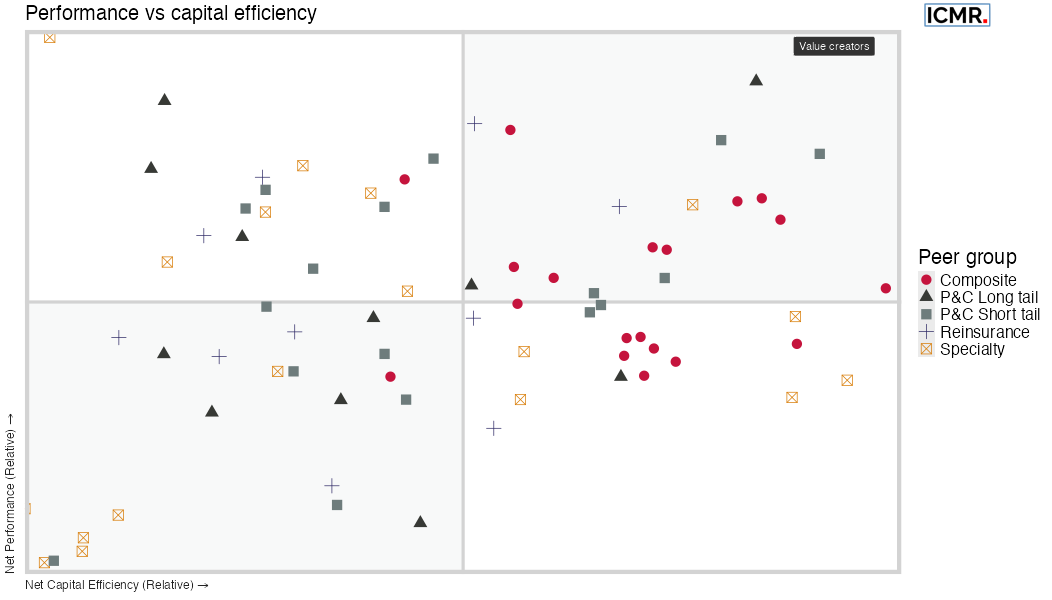
This chart plots each syndicate’s historical relative performance against its relative capitalisation (NB - this is based on ICMR’s outside-in modelling of every syndicate’s ECA requirement, as above).
It shows that the true value creators are those syndicates which both out perform and also have relatively lower capital requirements (in the top right quadrant of Figure 8.5), usually through diversification. Again, start-ups tend to have worse relative performance as well as capitalisation due to the cost and capital loads applied and begin life in the bottom left quadrant.
The key determinant of success then becomes the strategy for their journey out of the bottom left quadrant to both better performance and/or lower relative capital requirements. This journey can take several years.
Summary
Lloyd’s is clearly currently an attractive place to invest, with signs of increasing capital markets’ confidence of our industry exceeding WACC for a sustained period of time. This is not to say that capital markets are falling over themselves trying to get into Lloyd’s.
As recently as late 2023, a number of investment initiatives into Lloyd’s failed to generate sufficient interest to proceed. This suggests a greater reticence on the part of “direct” investors in risk when compared with the above context of public market investor confidence. This may simply be coincidental, but it also might show a shift in the trade off between on the one hand investor appetite for returns which are largely uncorrelated with markets, and on the other deep liquidity through public market listing combined with the increasing potential for value creation. Only time will tell.