The segmental analysis is based on the information disclosed in the notes to the accounts in each syndicate’s financial statements. The data has been curated by ICMR and is available as part of the ICMR.Data offering.
Although this section will focus on the aggregated data for four lines (Reinsurance, Casualty, Property and Specialty) the underlying data is more granular. All lines with the exception of Accident & Health have a higher number of syndicates participating in 2023 versus 2015, while those dipping and then increasing perhaps indicate where the most marked remediation and recovery activity has taken place.
5.1 Number of syndicates reporting by COB
COB
2015
2016
2017
2018
2019
2020
2021
2022
2023
Accident and health
50
50
47
45
46
48
54
52
50
Energy
25
25
26
30
29
34
34
35
34
MAT
82
84
78
80
78
79
96
96
100
Motor
48
49
47
47
49
52
50
56
54
Pecuniary loss
66
66
63
61
64
66
74
71
73
Property
71
73
69
70
66
69
80
83
84
Reinsurance
74
76
71
72
71
74
87
88
93
Third party liability
69
69
62
65
62
64
74
78
82
Table 5.1: Number of syndicates that reported gross underwriting performance data by class of business over the period, including run-offs
5.2 Aggregate gross written premium by COB
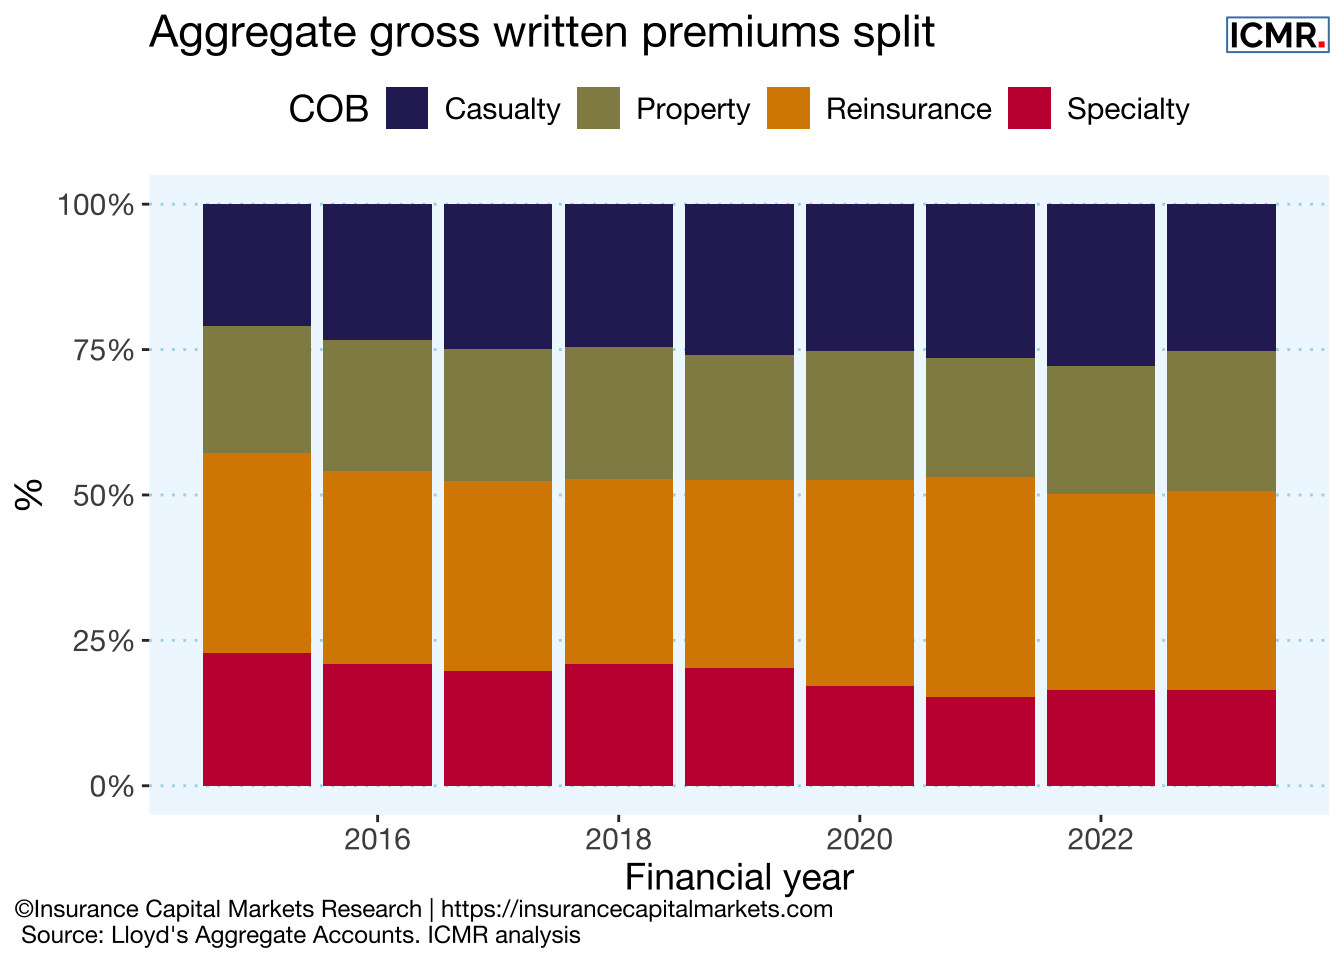
Aggregating the data to only four classes shows that the traditional specialty lines have become less material for Lloyd’s over time, while new classes such as Cyber have grown significantly as part of Casualty.
Figure 5.1: Gross written premium split by class of business
The strongest percentage growth has been in Casualty. Although Reinsurance remains the largest single class, it has reduced as a proportion of the whole. The Specialty class is now the smallest major class in the market.
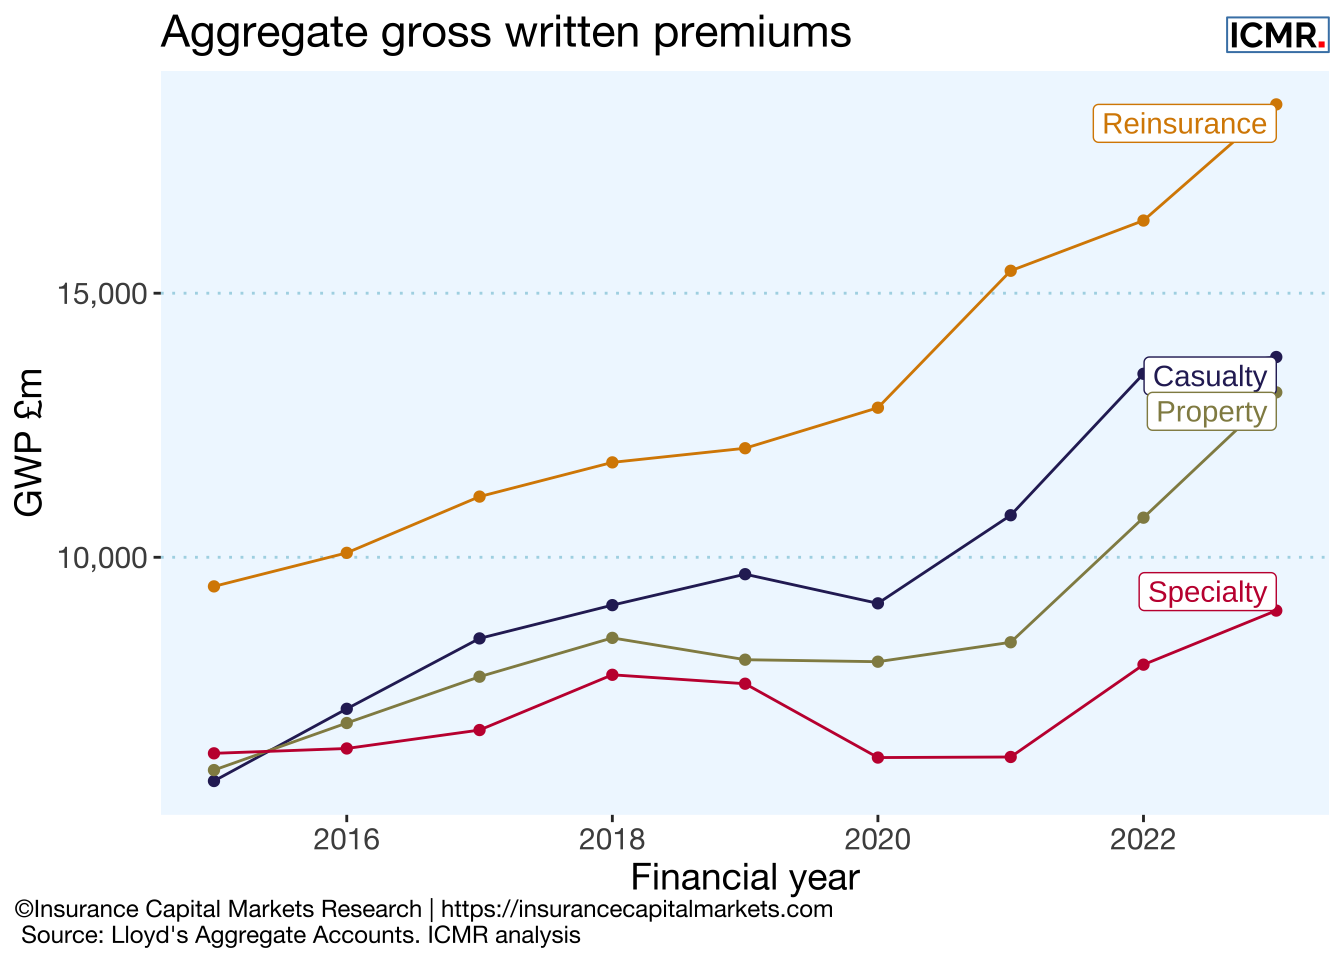
Figure 5.2: Lloyd’s aggregate gross written premium
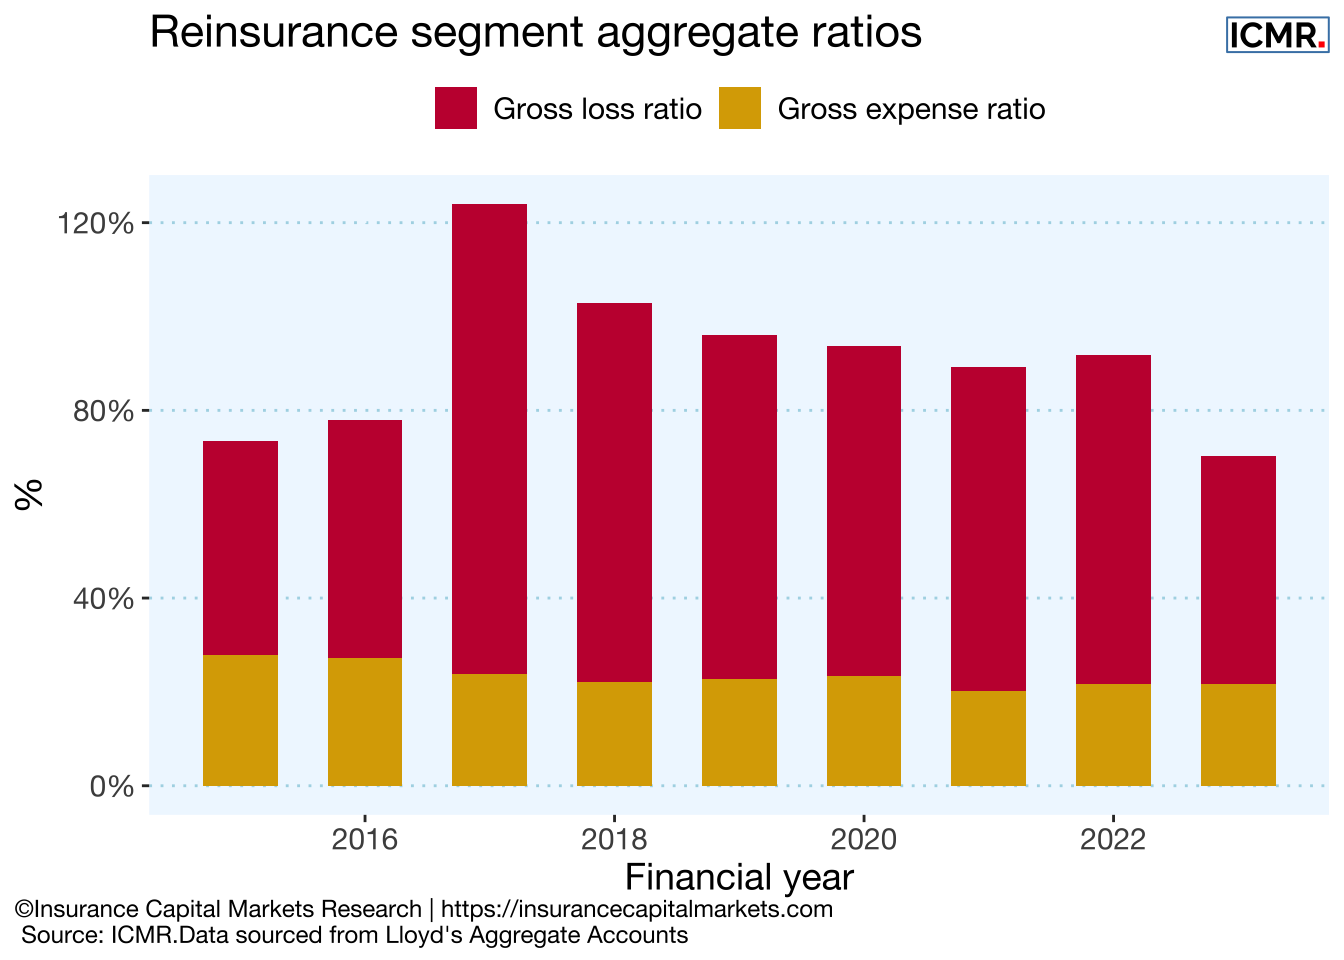
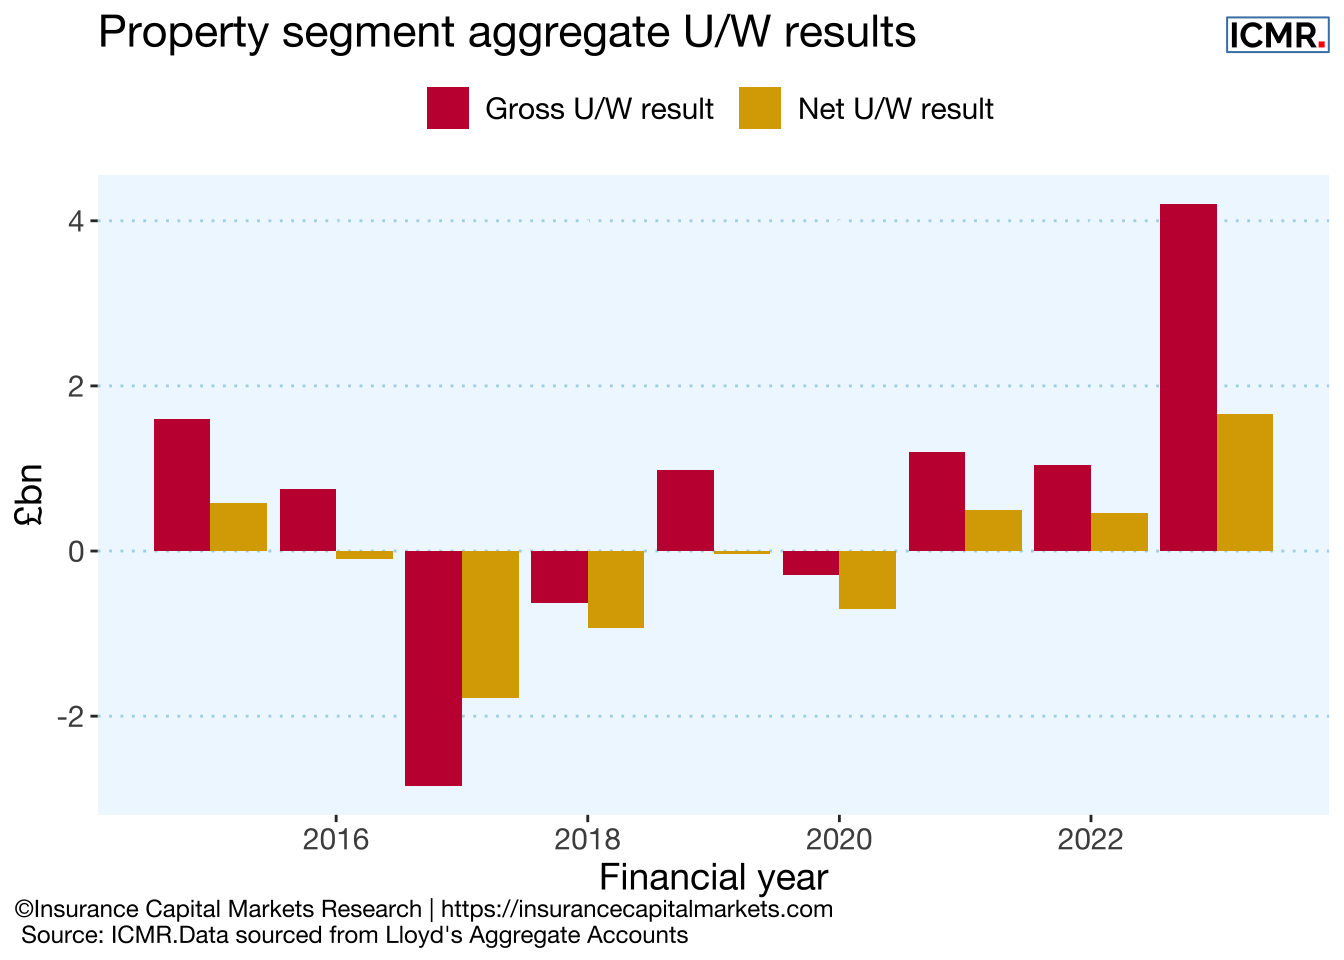
5.3 Aggregate underwriting results by COB
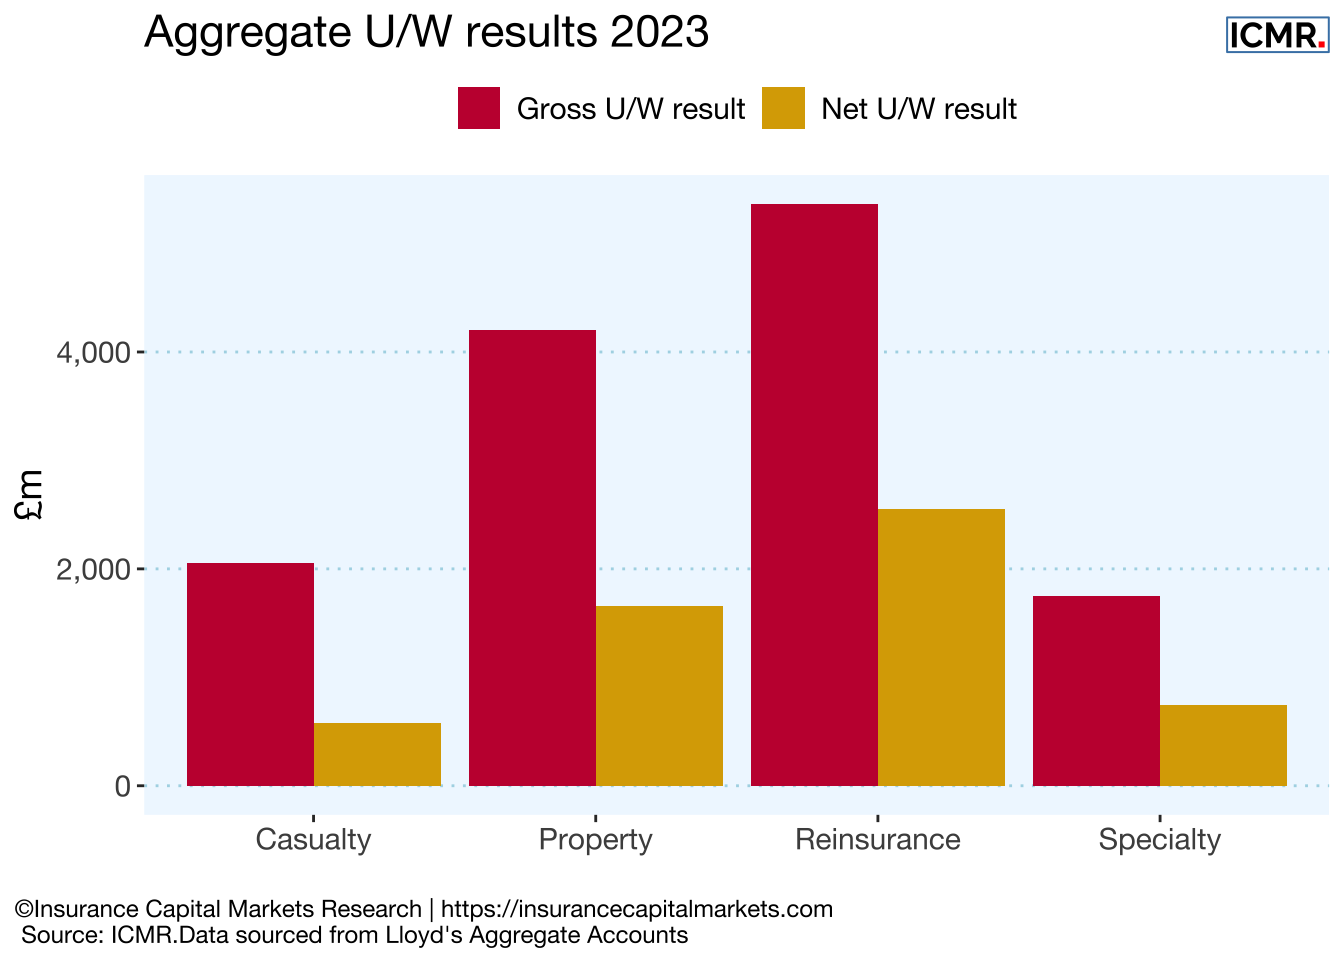
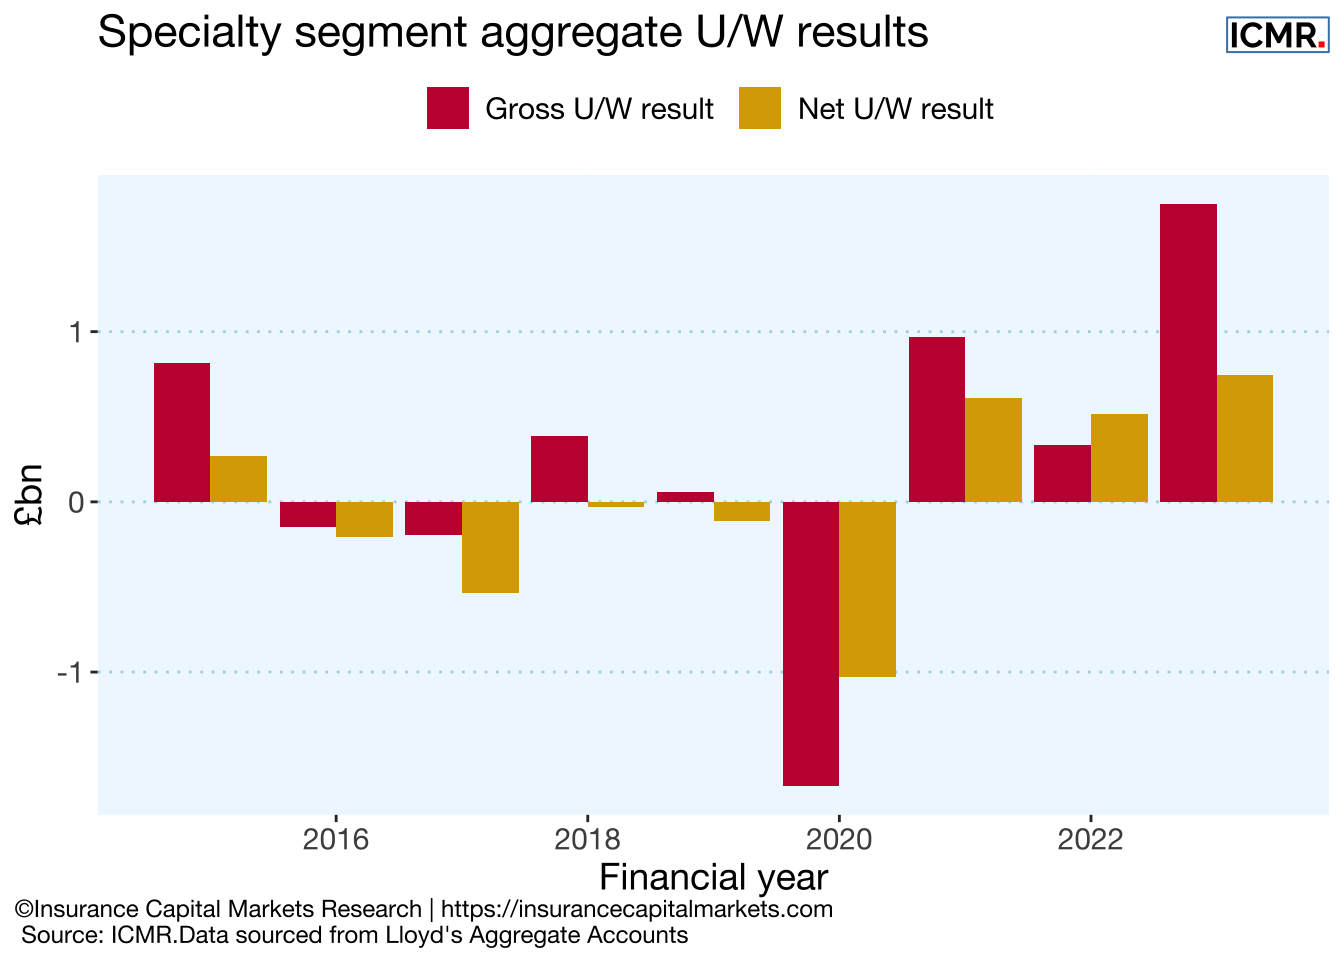
In 2023, all four classes delivered gross and net underwriting profits in the aggregate.
Figure 5.3: Aggregate gross and net underwriting results at Lloyd’s in 2023
The next sections delve deeper into the data by COB, reviewing the performance over time, the gross U/W risk vs reward profile and changes in market concentration.
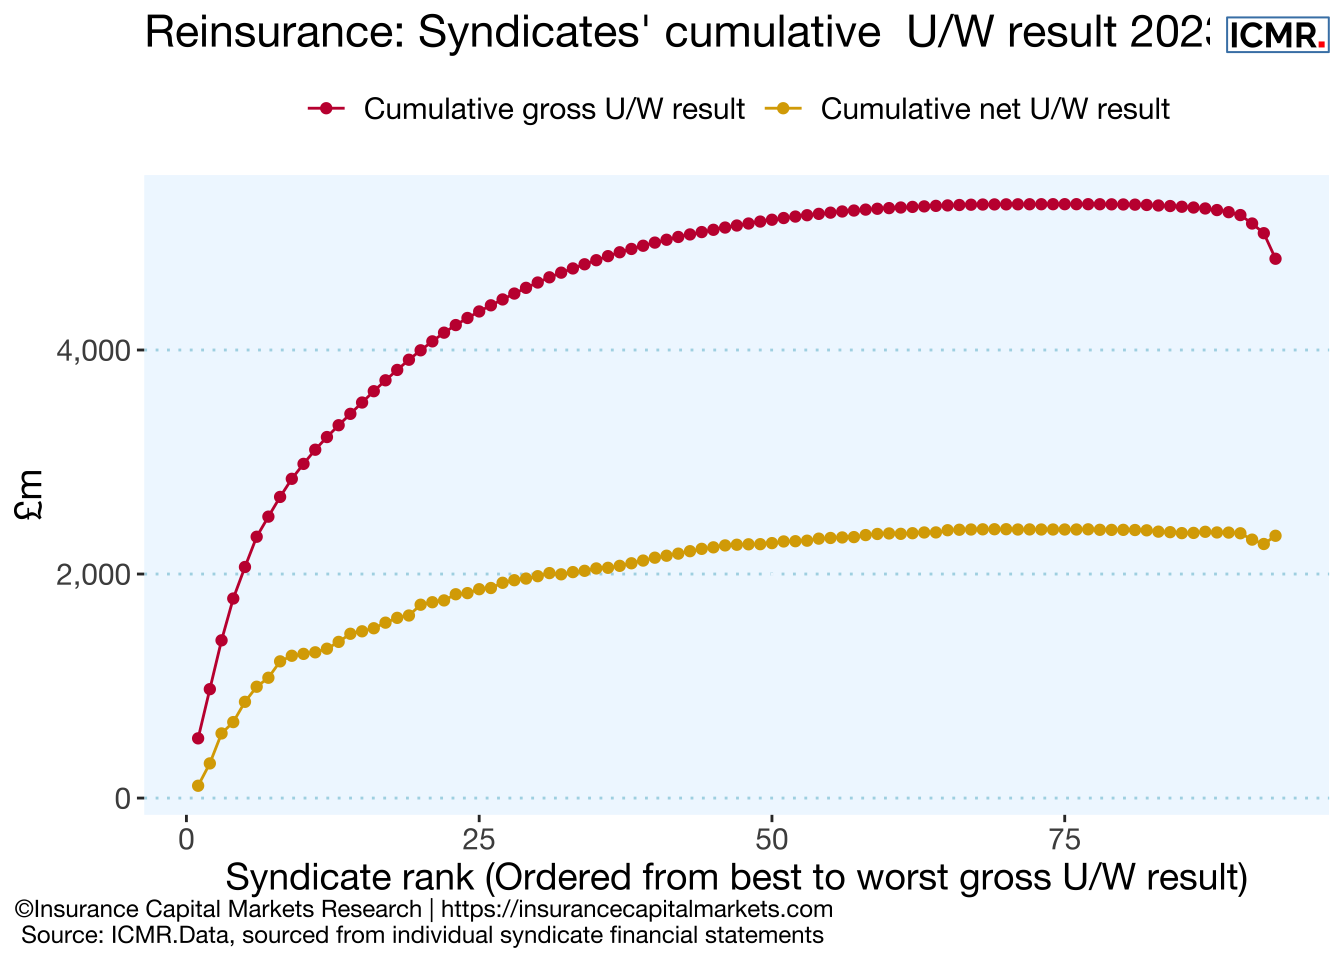
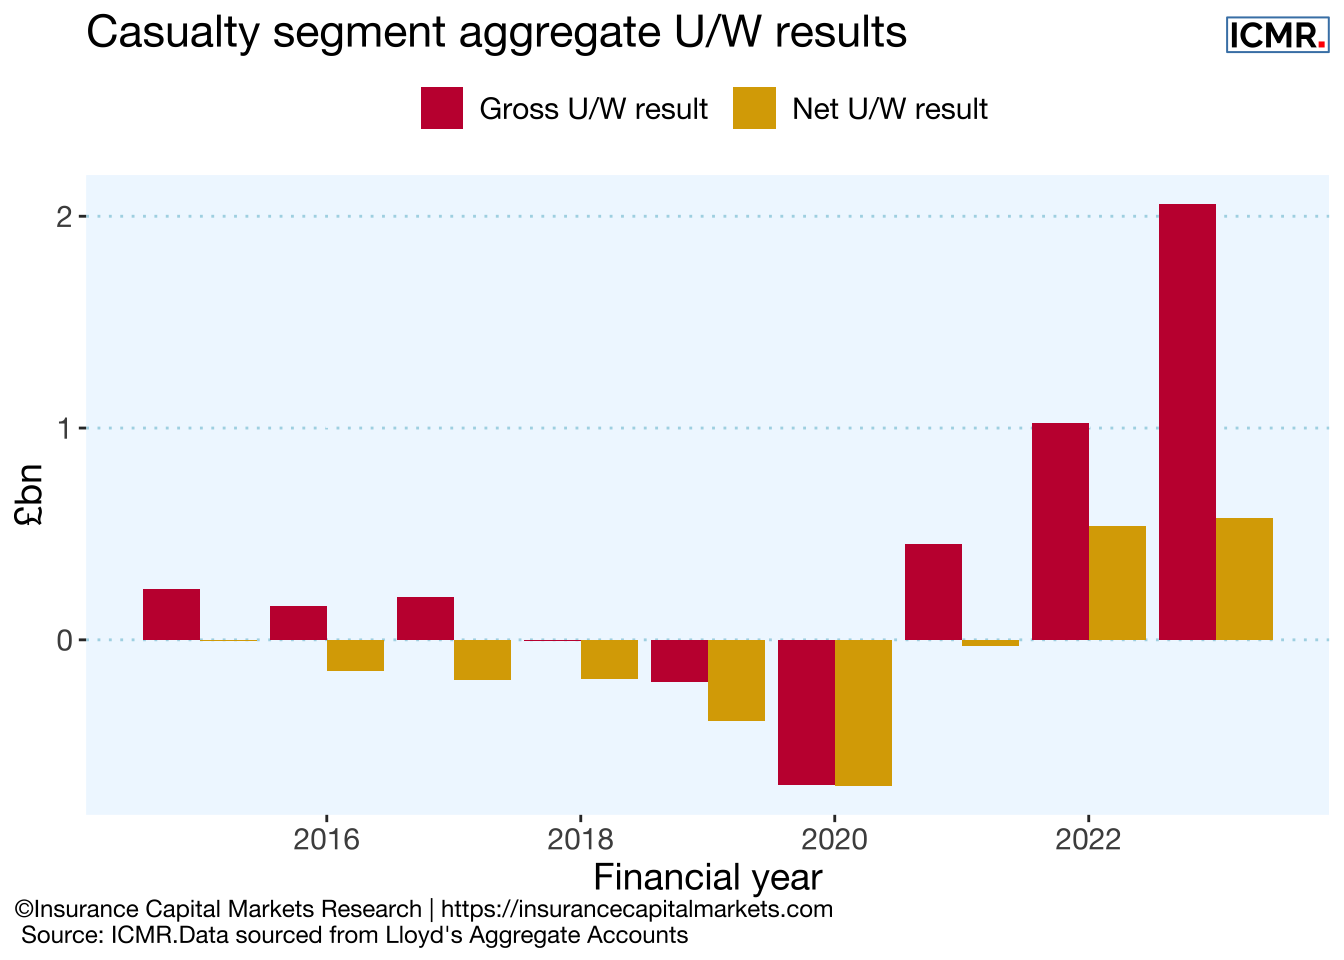
Reviewing performance on a gross performance basis has the advantage of eliminating the impact of different reinsurance structures, particularly inter-group reinsurance and legacy transactions.
All classes show a reduction in the operating expense ratio over time, and all classes but Casualty also show a reduction in market share of the top 5 biggest syndicates by GWP.
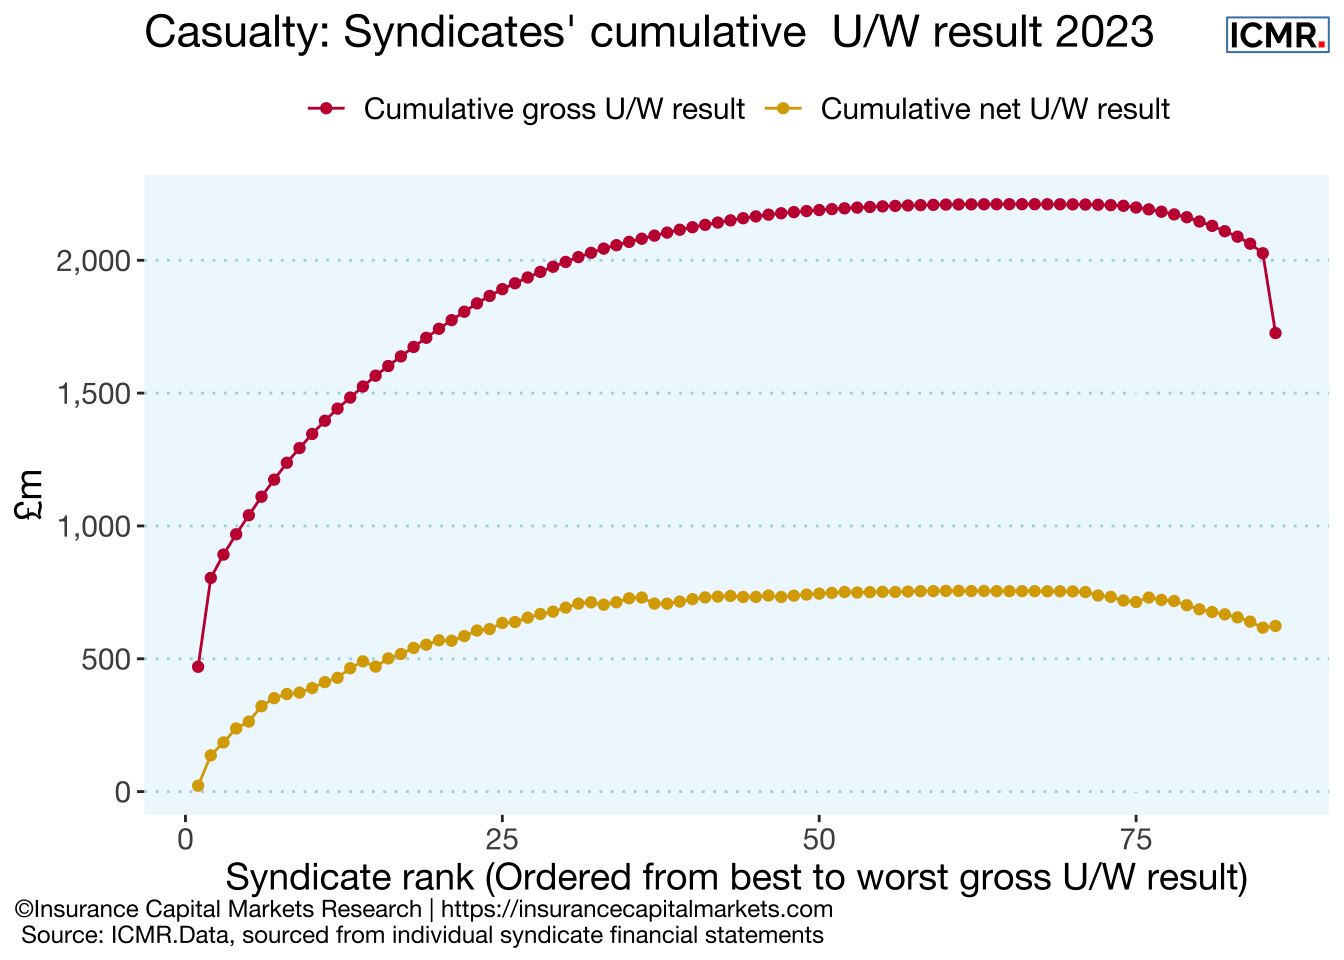
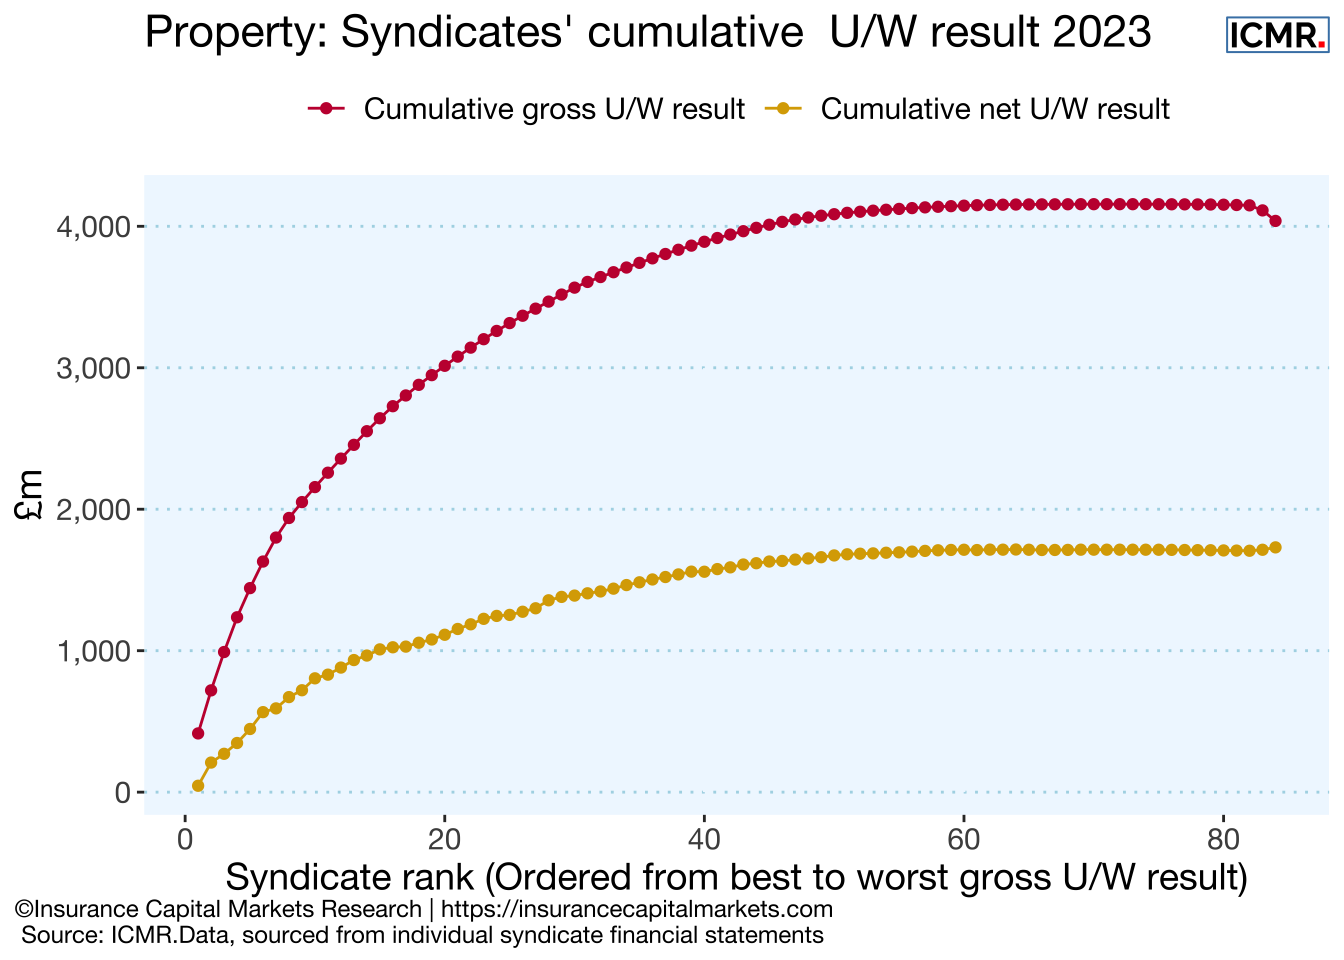
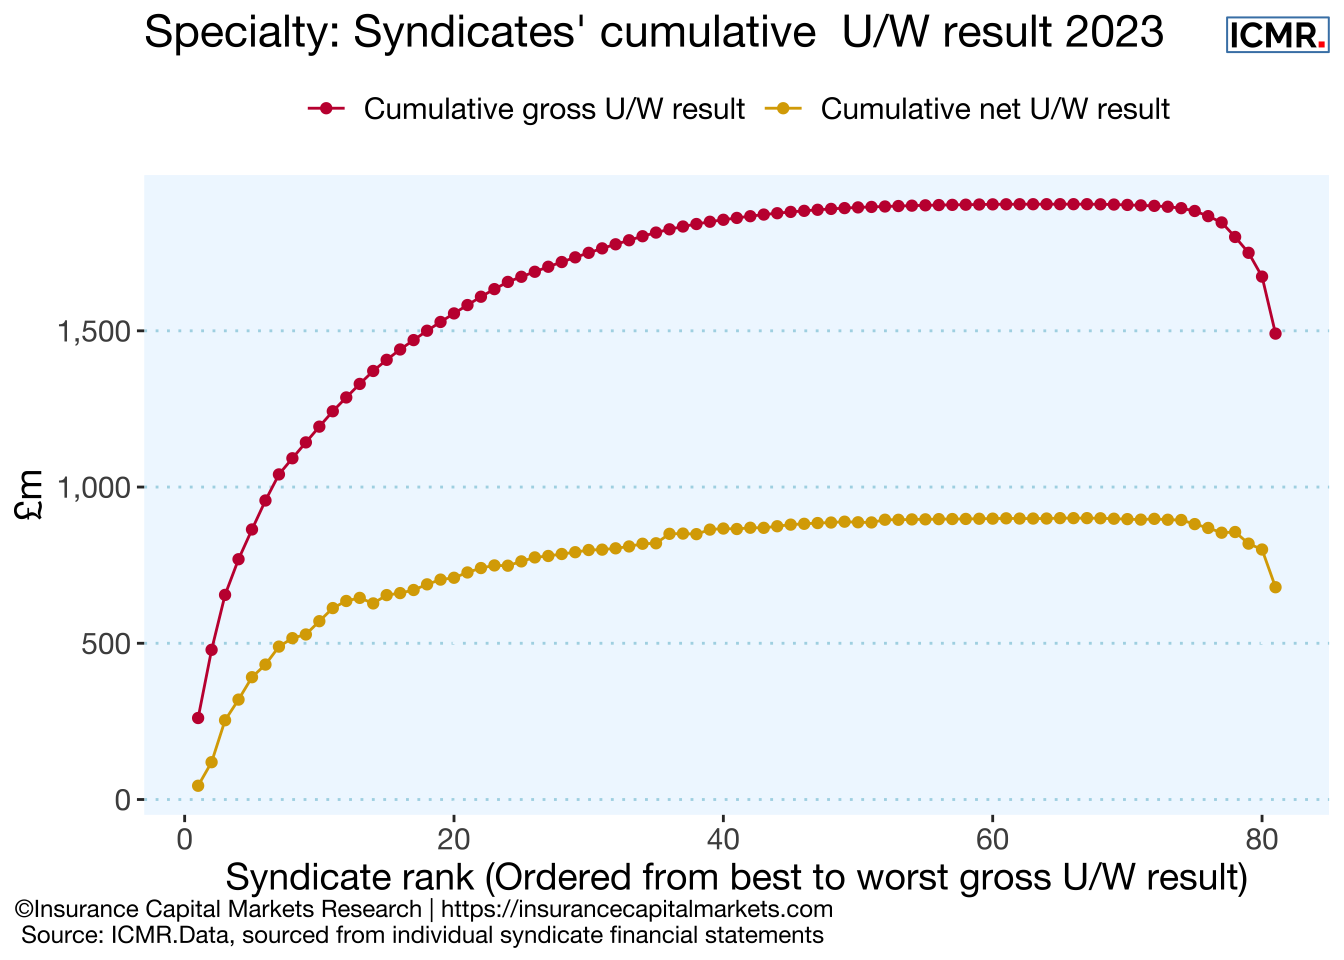
Figure 5.4: Cumulative syndicate gross and net underwriting results, ordered from most to least profitable on a gross basis. The net underwriting results follow the gross in the same syndicate order. The difference in quantum between the lines is reinsurers’ share of the gross profit. SPAs have been excluded.
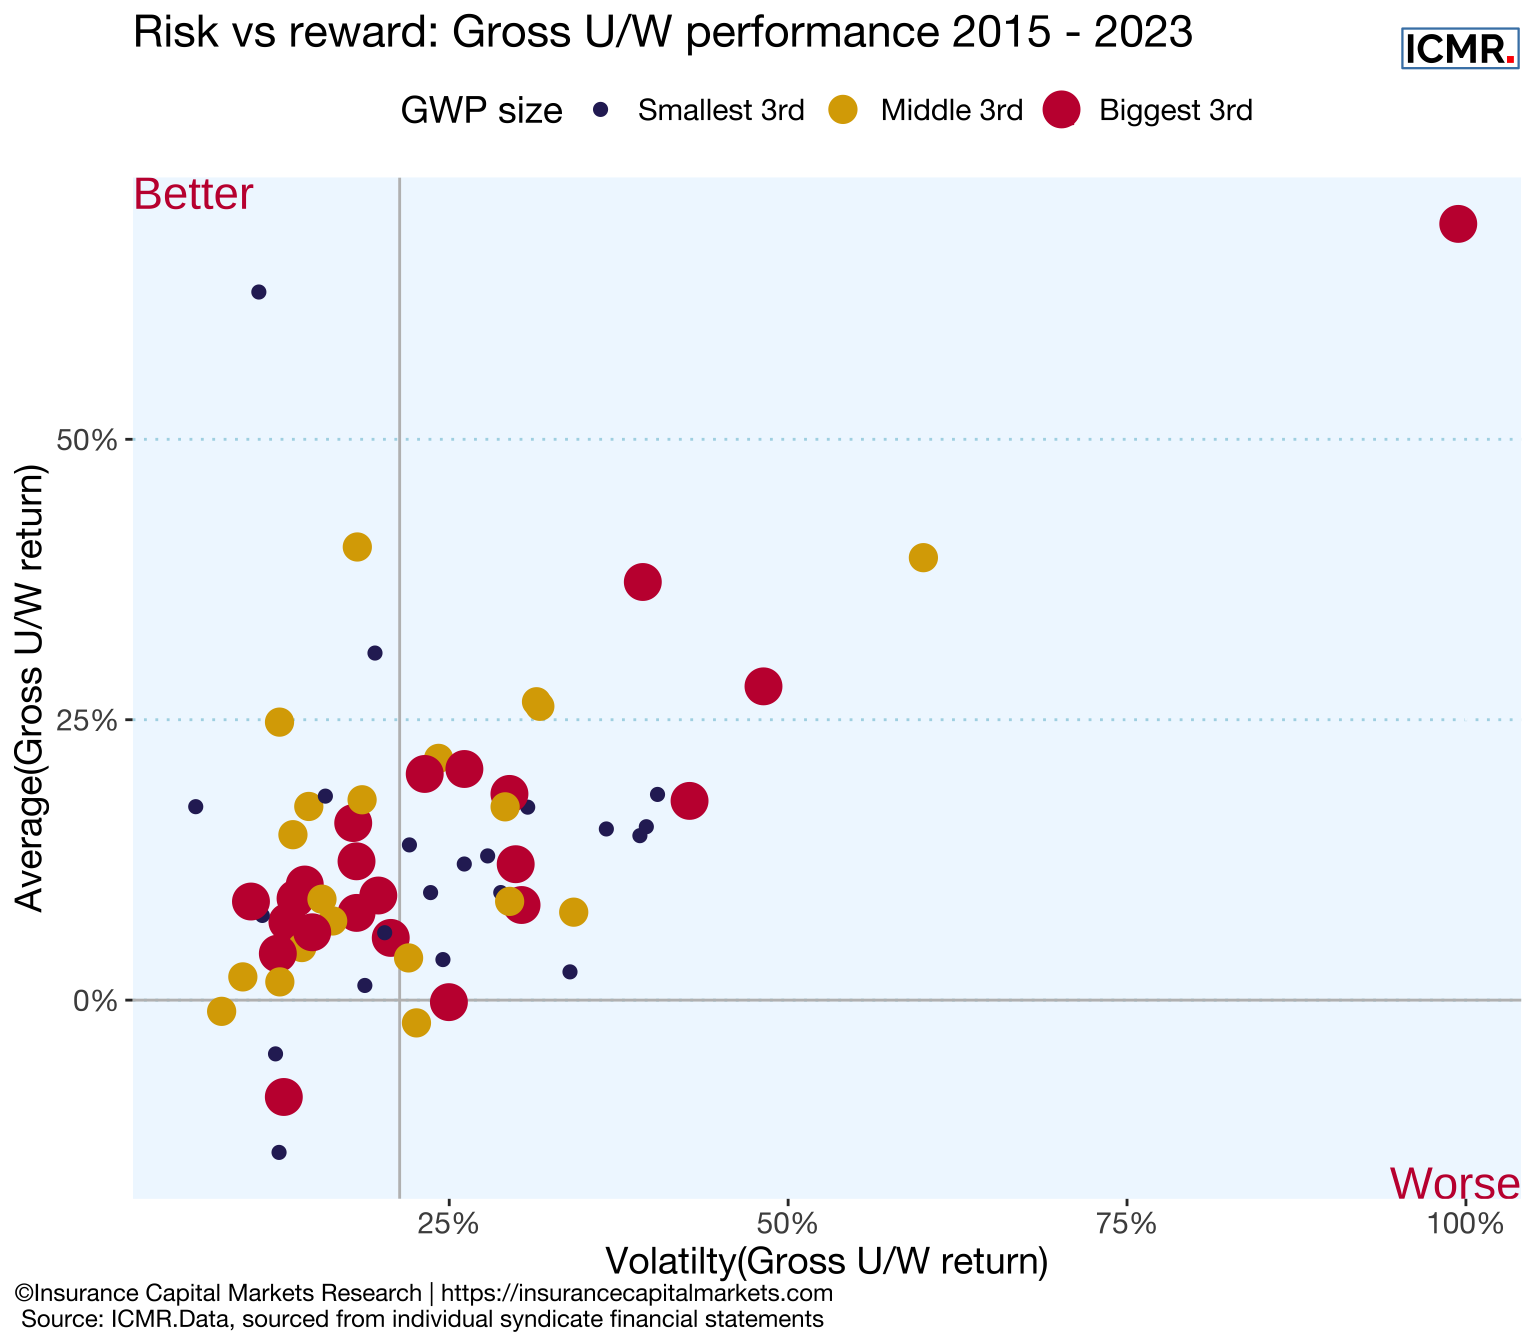
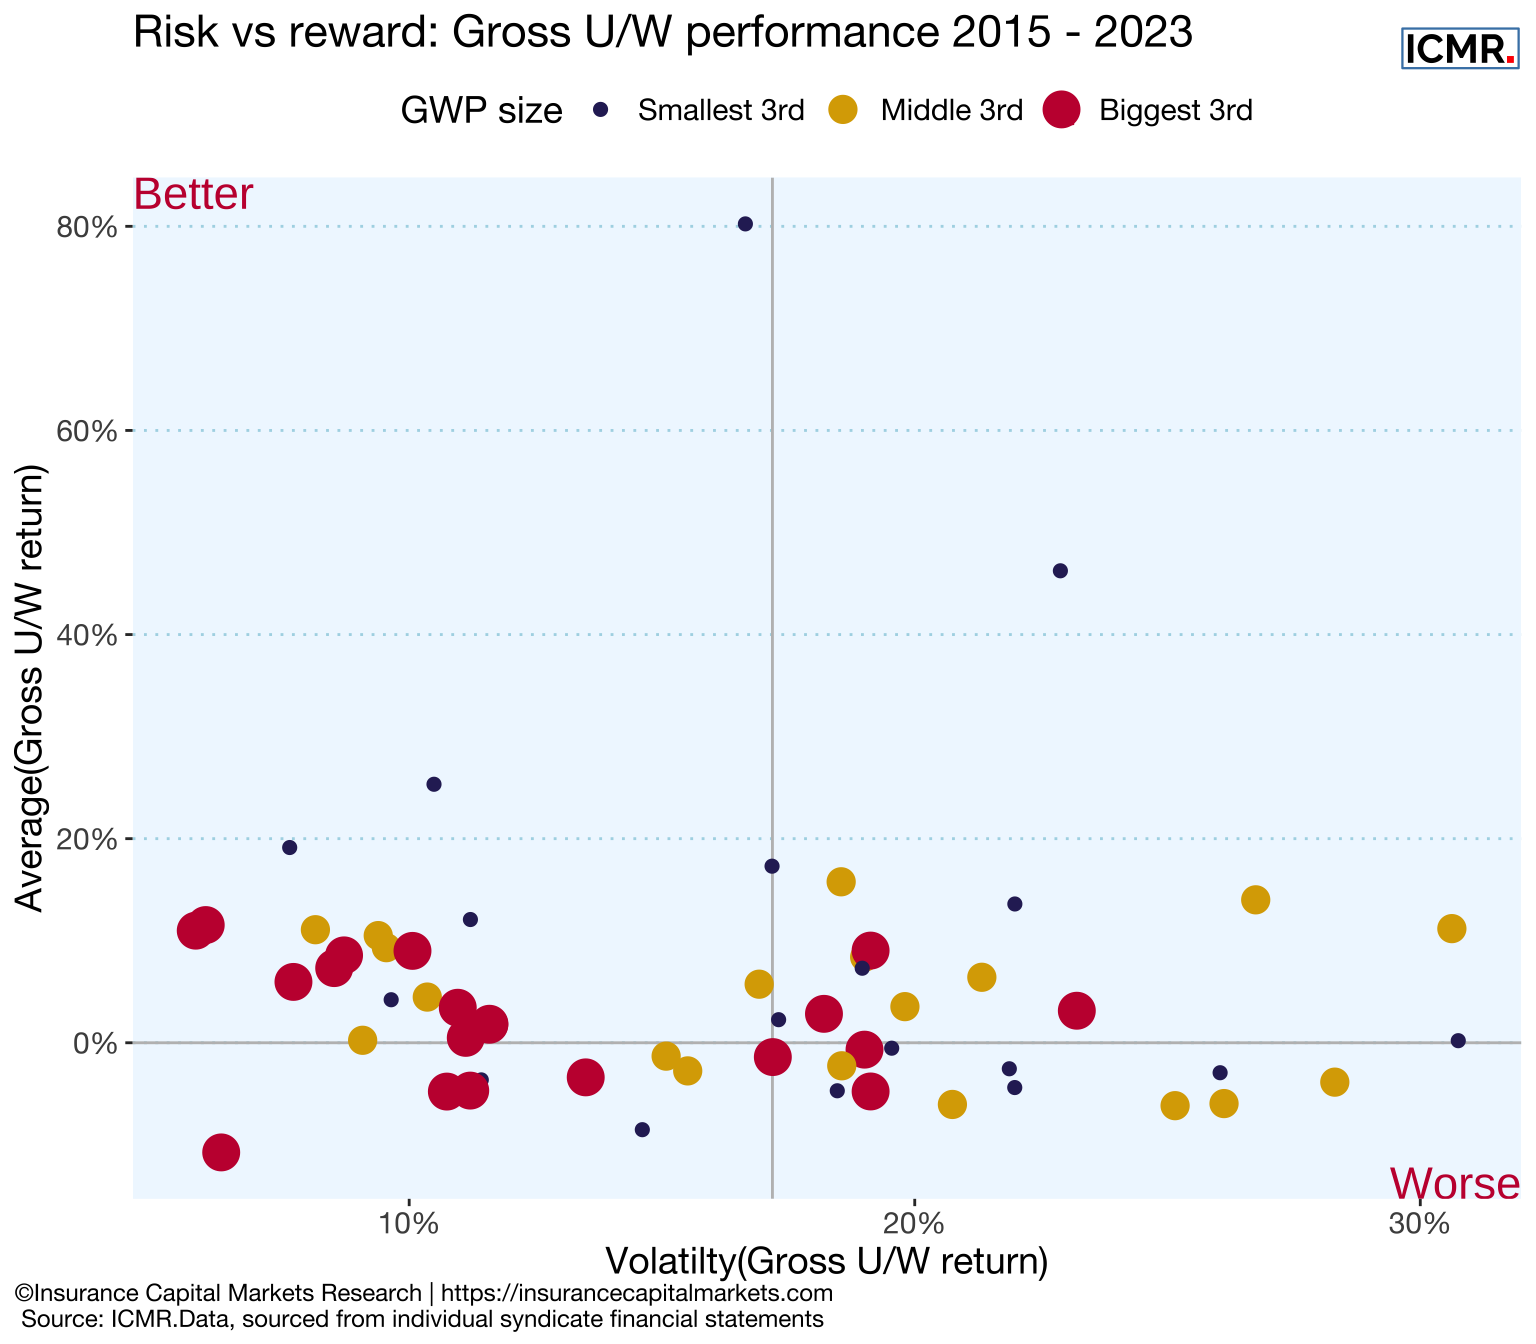
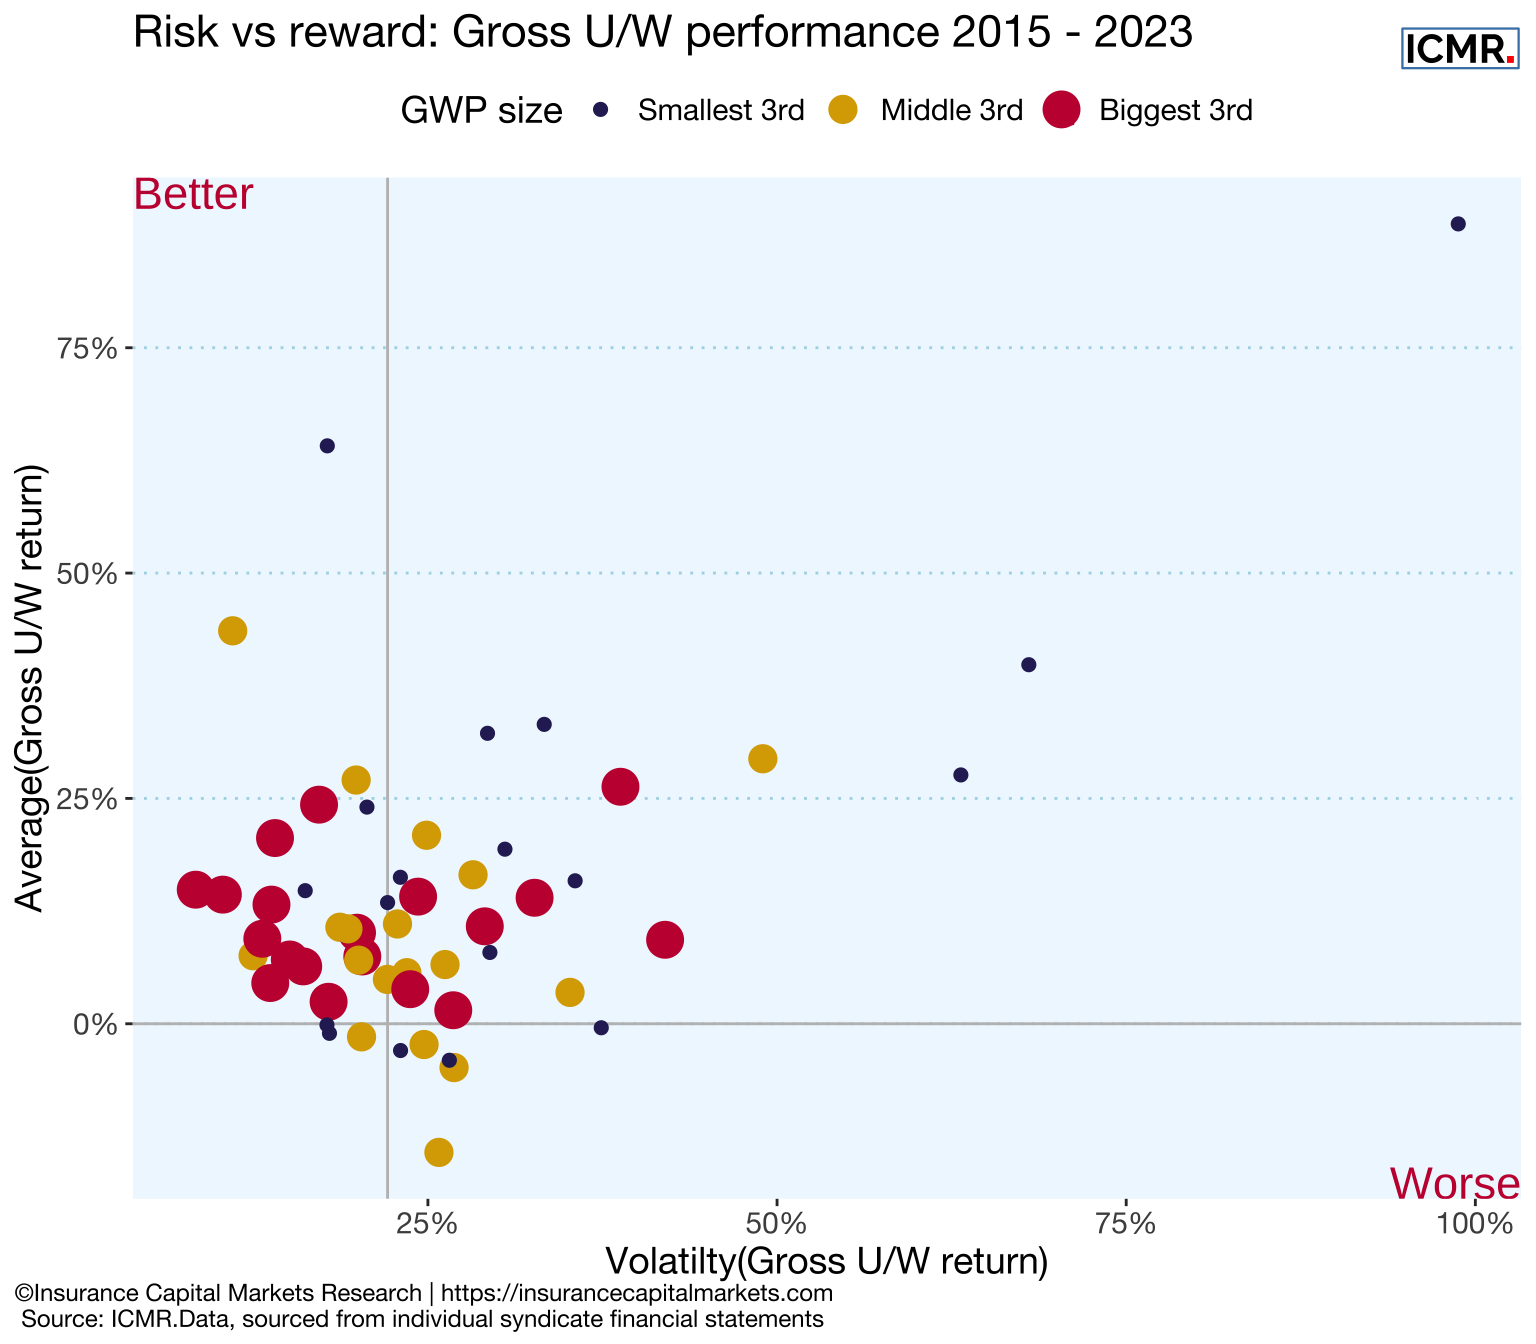
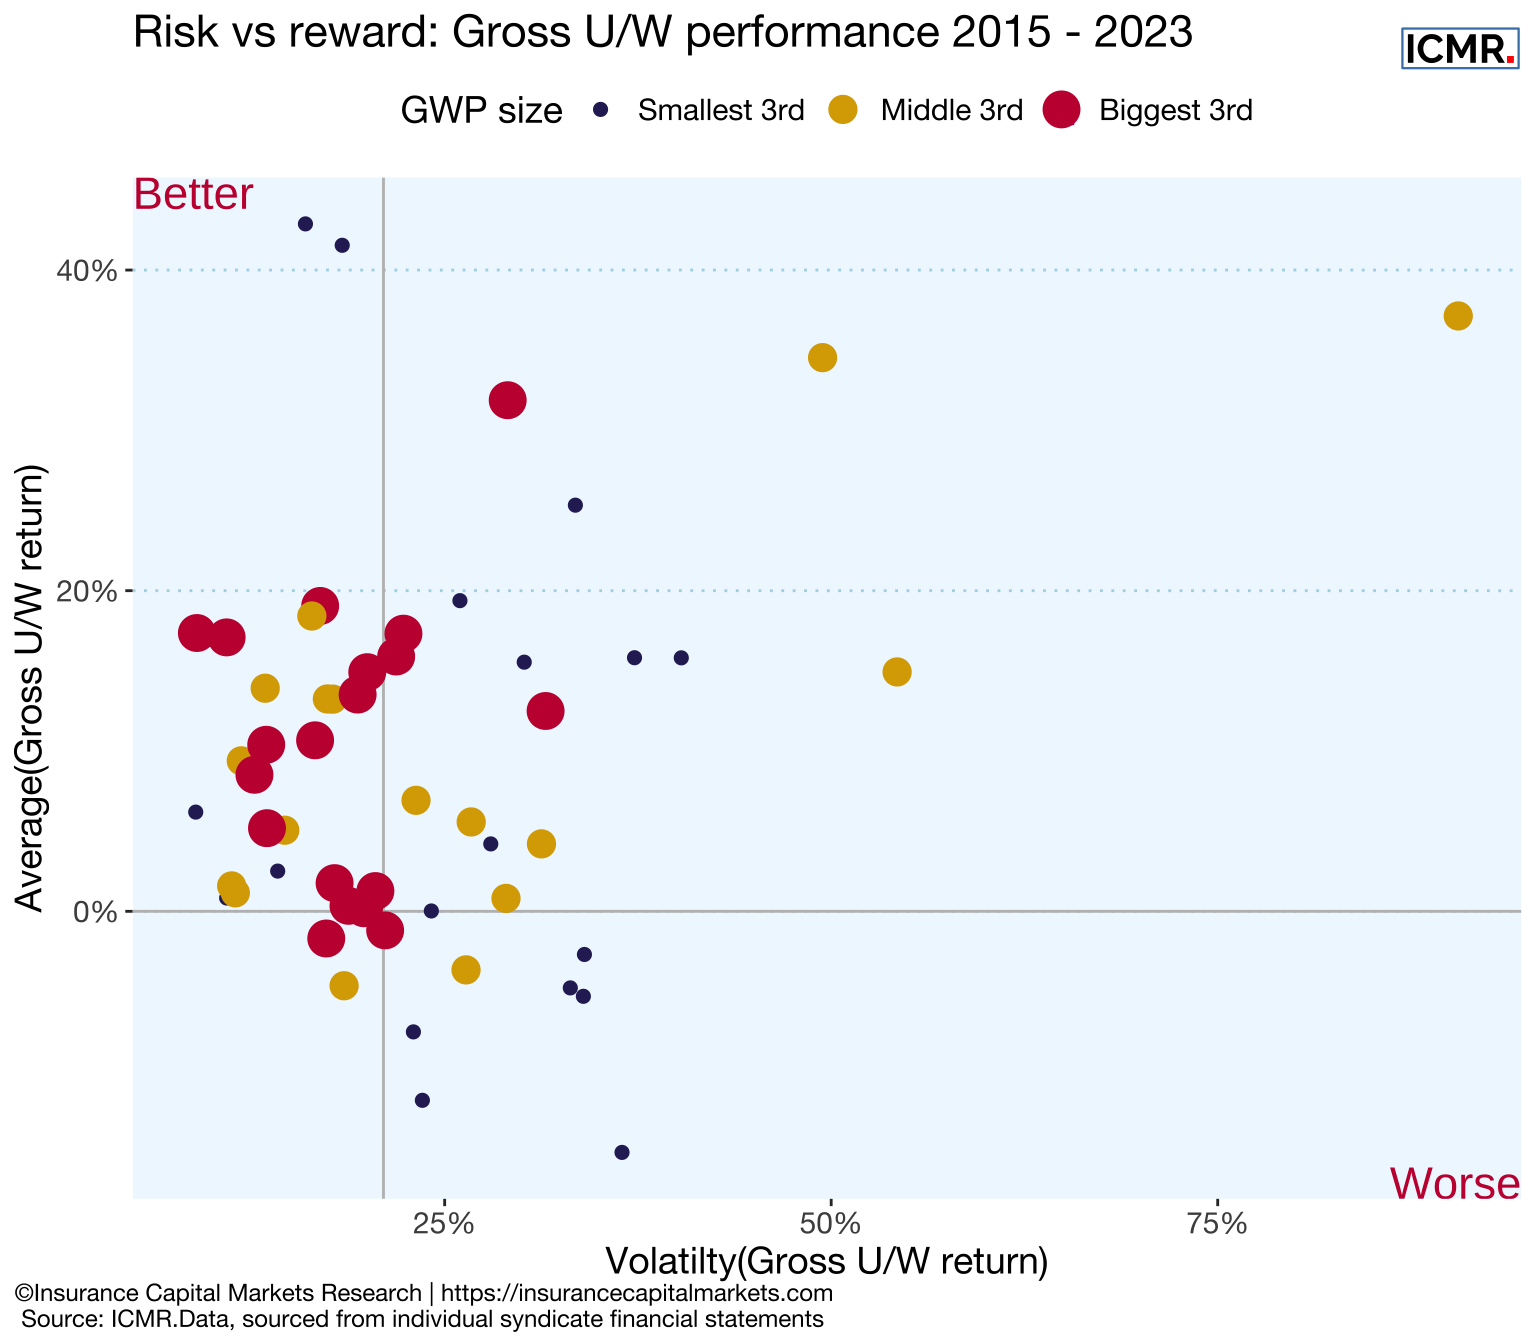
Figure 5.5: Distribution of syndicates’ annual gross U/W return (= 100% - Gross combined ratio) over time. Syndicates (dots) in the top left represent entities with high gross U/W returns and low volatility (good), syndicates (dots) in the bottom right have more volatile and lower gross U/W returns (bad). The vertical line represents the median.
Table 5.2: GWP, gross & net U/W result from Lloyd’s Aggregate Accounts, number of syndicates and top 5 share from individual non-life syndicate financial statements. Source: ICMR.Data
Financial year
Gross loss ratio
Gross expense ratio
Gross combined ratio
2015
45.8%
27.8%
73.5%
2016
50.8%
27.3%
78.1%
2017
100.2%
23.8%
123.9%
2018
80.9%
22.1%
102.9%
2019
73.3%
22.7%
96.1%
2020
70.3%
23.5%
93.7%
2021
69.2%
20.1%
89.3%
2022
70.0%
21.7%
91.7%
2023
48.5%
21.7%
70.2%
Mean
67.7%
23.4%
91.1%
StDev
17.4%
2.6%
16.5%
Table 5.3: ICMR.Data, sourced from Lloyd’s Aggregate Accounts
Figure 5.8: Cumulative syndicate gross and net underwriting results, ordered from most to least profitable on a gross basis. The net underwriting results follow the gross in the same syndicate order. The difference in quantum between the lines is reinsurers’ share of the gross profit. SPAs have been excluded.
Figure 5.9: Distribution of syndicates’ annual gross U/W return (= 100% - Gross combined ratio) over time. Syndicates (dots) in the top left represent entities with high gross U/W returns and low volatility (good), syndicates (dots) in the bottom right have more volatile and lower gross U/W returns (bad). The vertical line represents the median.
Table 5.4: GWP, gross & net U/W result from Lloyd’s Aggregate Accounts, number of syndicates and top 5 share from individual non-life syndicate financial statements. Source: ICMR.Data
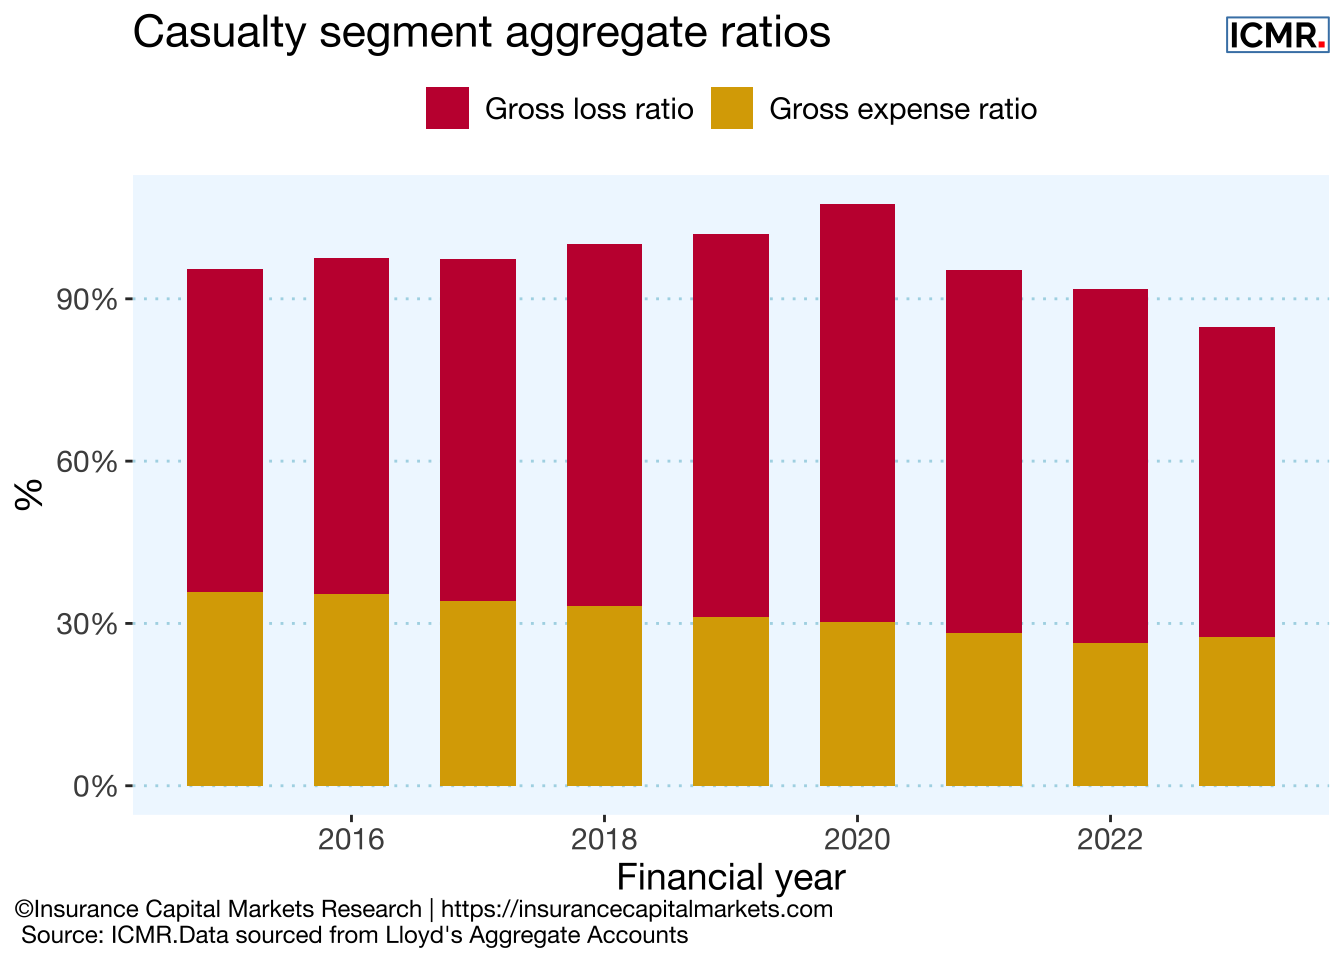
Financial year
Gross loss ratio
Gross expense ratio
Gross combined ratio
2015
59.8%
35.7%
95.6%
2016
62.1%
35.5%
97.6%
2017
63.3%
34.1%
97.4%
2018
66.8%
33.3%
100.0%
2019
70.9%
31.2%
102.1%
2020
77.3%
30.2%
107.5%
2021
67.1%
28.3%
95.4%
2022
65.4%
26.4%
91.8%
2023
57.2%
27.5%
84.7%
Mean
65.5%
31.4%
96.9%
StDev
6.0%
3.5%
6.4%
Table 5.5: ICMR.Data, sourced from Lloyd’s Aggregate Accounts
Figure 5.12: Cumulative syndicate gross and net underwriting results, ordered from most to least profitable on a gross basis. The net underwriting results follow the gross in the same syndicate order. The difference in quantum between the lines is reinsurers’ share of the gross profit. SPAs have been excluded.
Figure 5.13: Distribution of syndicates’ annual gross U/W return (= 100% - Gross combined ratio) over time. Syndicates (dots) in the top left represent entities with high gross U/W returns and low volatility (good), syndicates (dots) in the bottom right have more volatile and lower gross U/W returns (bad). The vertical line represents the median.
Table 5.6: GWP, gross & net U/W result from Lloyd’s Aggregate Accounts, number of syndicates and top 5 share from individual non-life syndicate financial statements. Source: ICMR.Data
Financial year
Gross loss ratio
Gross expense ratio
Gross combined ratio
2015
38.1%
34.2%
72.4%
2016
54.5%
34.1%
88.6%
2017
103.8%
33.3%
137.1%
2018
75.3%
32.4%
107.7%
2019
57.4%
30.5%
87.9%
2020
73.8%
29.9%
103.6%
2021
55.6%
29.7%
85.3%
2022
62.1%
27.6%
89.7%
2023
37.6%
27.4%
65.0%
Mean
62.0%
31.0%
93.0%
StDev
20.5%
2.6%
21.2%
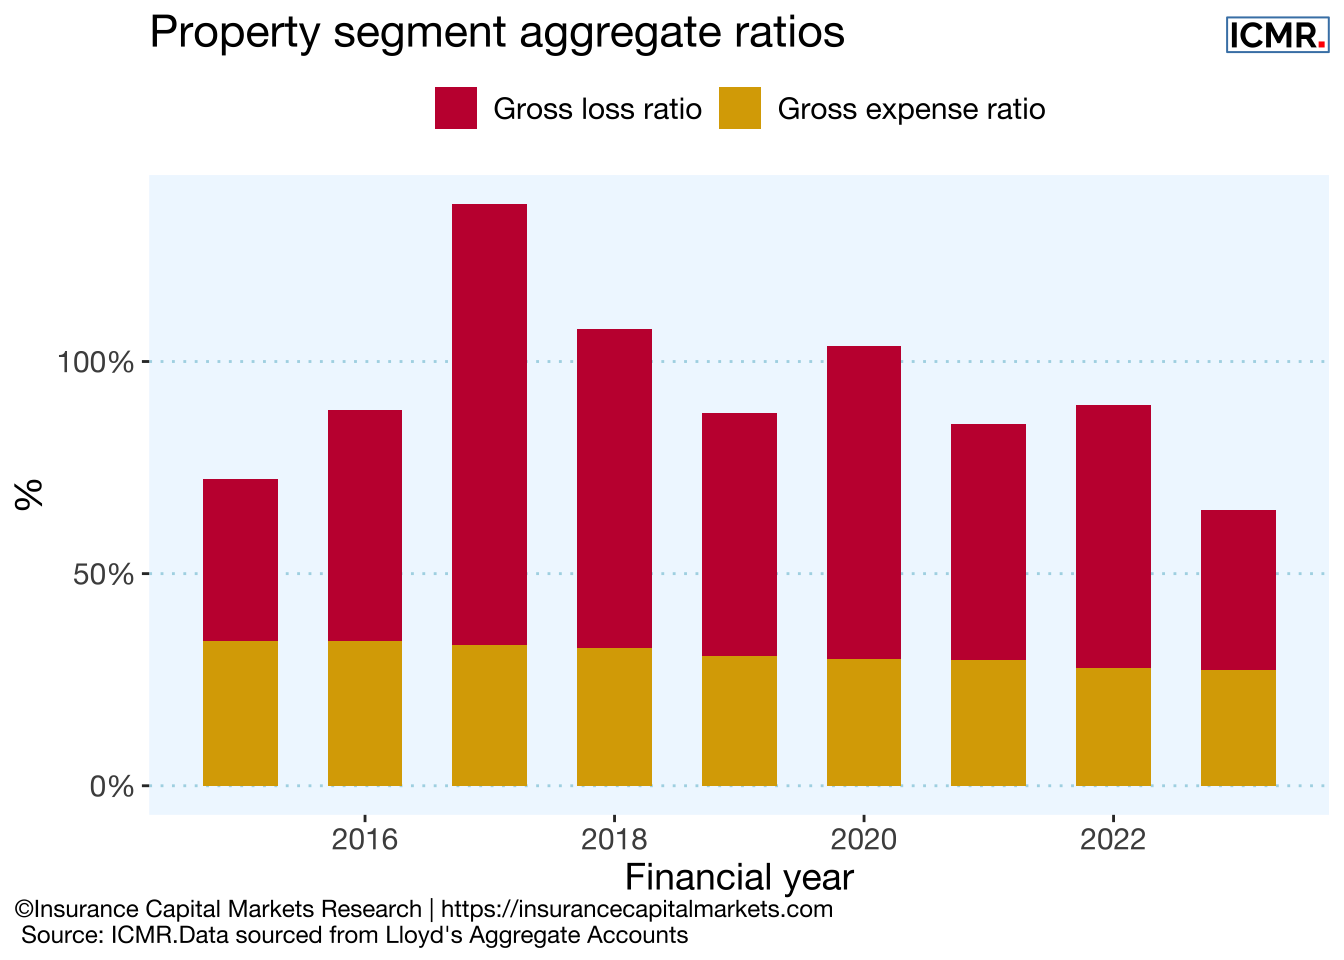
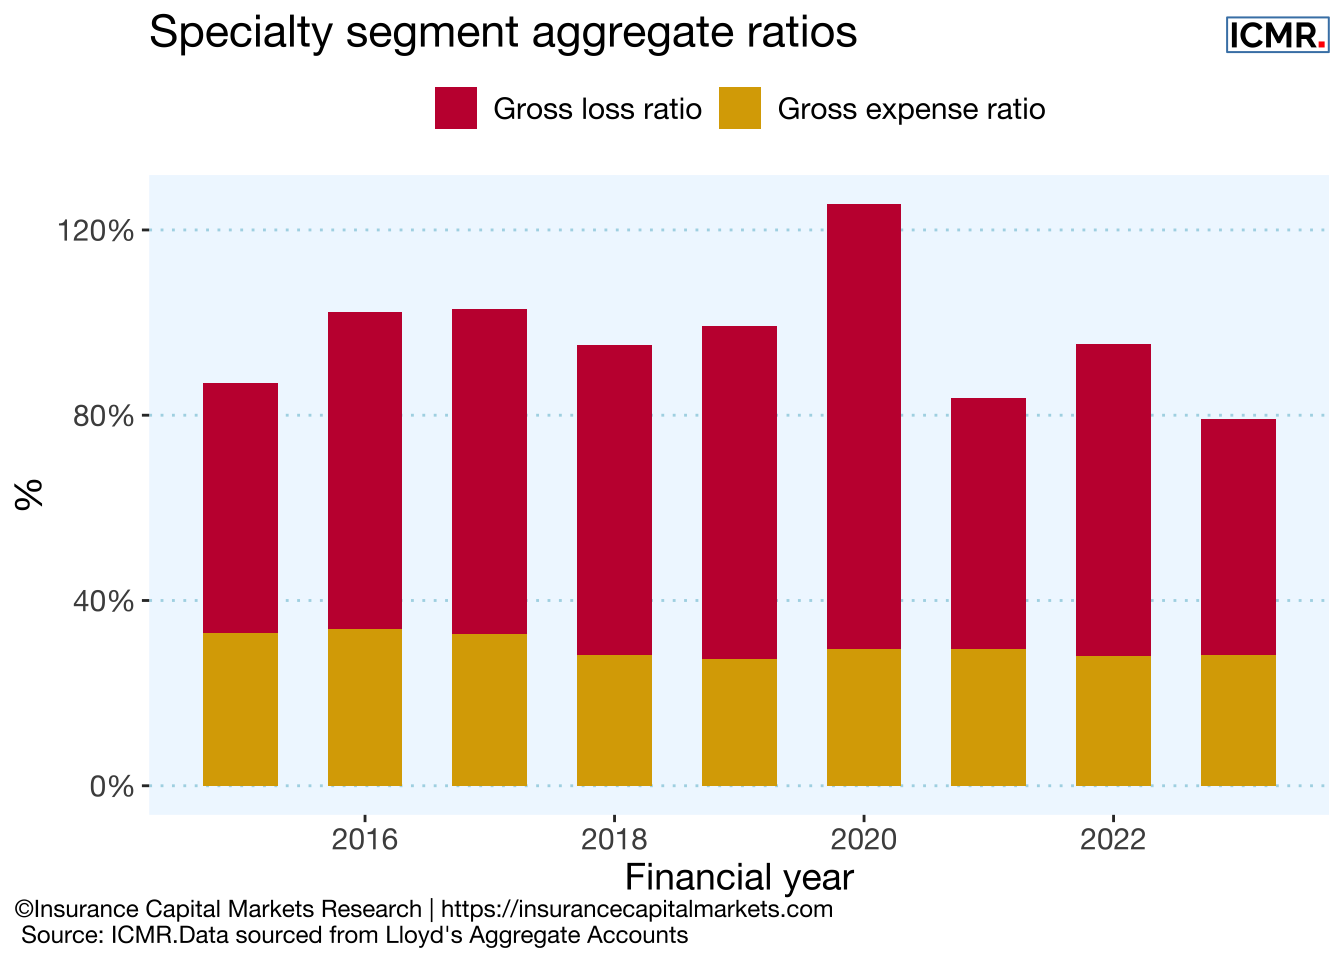
Table 5.7: ICMR.Data, sourced from Lloyd’s Aggregate Accounts
Figure 5.16: Cumulative syndicate gross and net underwriting results, ordered from most to least profitable on a gross basis. The net underwriting results follow the gross in the same syndicate order. The difference in quantum between the lines is reinsurers’ share of the gross profit. SPAs have been excluded.
Figure 5.17: Distribution of syndicates’ annual gross U/W return (= 100% - Gross combined ratio) over time. Syndicates (dots) in the top left represent entities with high gross U/W returns and low volatility (good), syndicates (dots) in the bottom right have more volatile and lower gross U/W returns (bad). The vertical line represents the median.
Table 5.8: GWP, gross & net U/W result from Lloyd’s Aggregate Accounts, number of syndicates and top 5 share from individual non-life syndicate financial statements. Source: ICMR.Data
Financial year
Gross loss ratio
Gross expense ratio
Gross combined ratio
2015
54.0%
32.9%
86.9%
2016
68.6%
33.8%
102.4%
2017
70.1%
32.8%
102.9%
2018
66.8%
28.3%
95.1%
2019
71.8%
27.4%
99.2%
2020
96.1%
29.5%
125.6%
2021
54.1%
29.6%
83.7%
2022
67.5%
27.9%
95.4%
2023
51.0%
28.2%
79.2%
Mean
66.7%
30.0%
96.7%
StDev
13.6%
2.4%
13.6%
Table 5.9: ICMR.Data, sourced from Lloyd’s Aggregate Accounts