The Tide Isn’t Going Out Equally for Every Syndicate at Lloyd’s
As the cycle turns, granular syndicate data is the only way to track how past out-performers are positioning for the shift.
Investors in the Lloyd’s market have had an excellent run over the last 3 years and (subject to any further catastrophes this year) should have a very good 2026. As night follows day, this will (and in many classes already does) result in pricing pushback from clients. One of the main topics at the recent Rendez-Vous was observable price reductions and what that might mean for investors going forwards.
When the Lloyd’s market begins to soften, the macro narrative often suggests a uniform shift—a falling tide lowering all boats. But look under the hood, and a very different reality emerges. The market doesn’t turn in unison. The syndicates that historically outperformed during previous soft cycles aren’t waiting for the aggregate data to reflect a downturn; they are already pivoting. For capital providers, brokers, and competing underwriters, relying on broad market averages means flying blind to these early, critical manoeuvres.
Moving Beyond Macro Averages
Everyone knows the cycle exists but there is no consensus on exactly what a cycle should look like. So we at ICMR decided to look at our comprehensive dataset through the prism of observable cyclical behaviours. To be clear, this isn’t a recipe book for what makes a good underwriter, merely the observation of differences in historical behaviour between top and bottom quartile performers, to see if any discernible trends emerge.
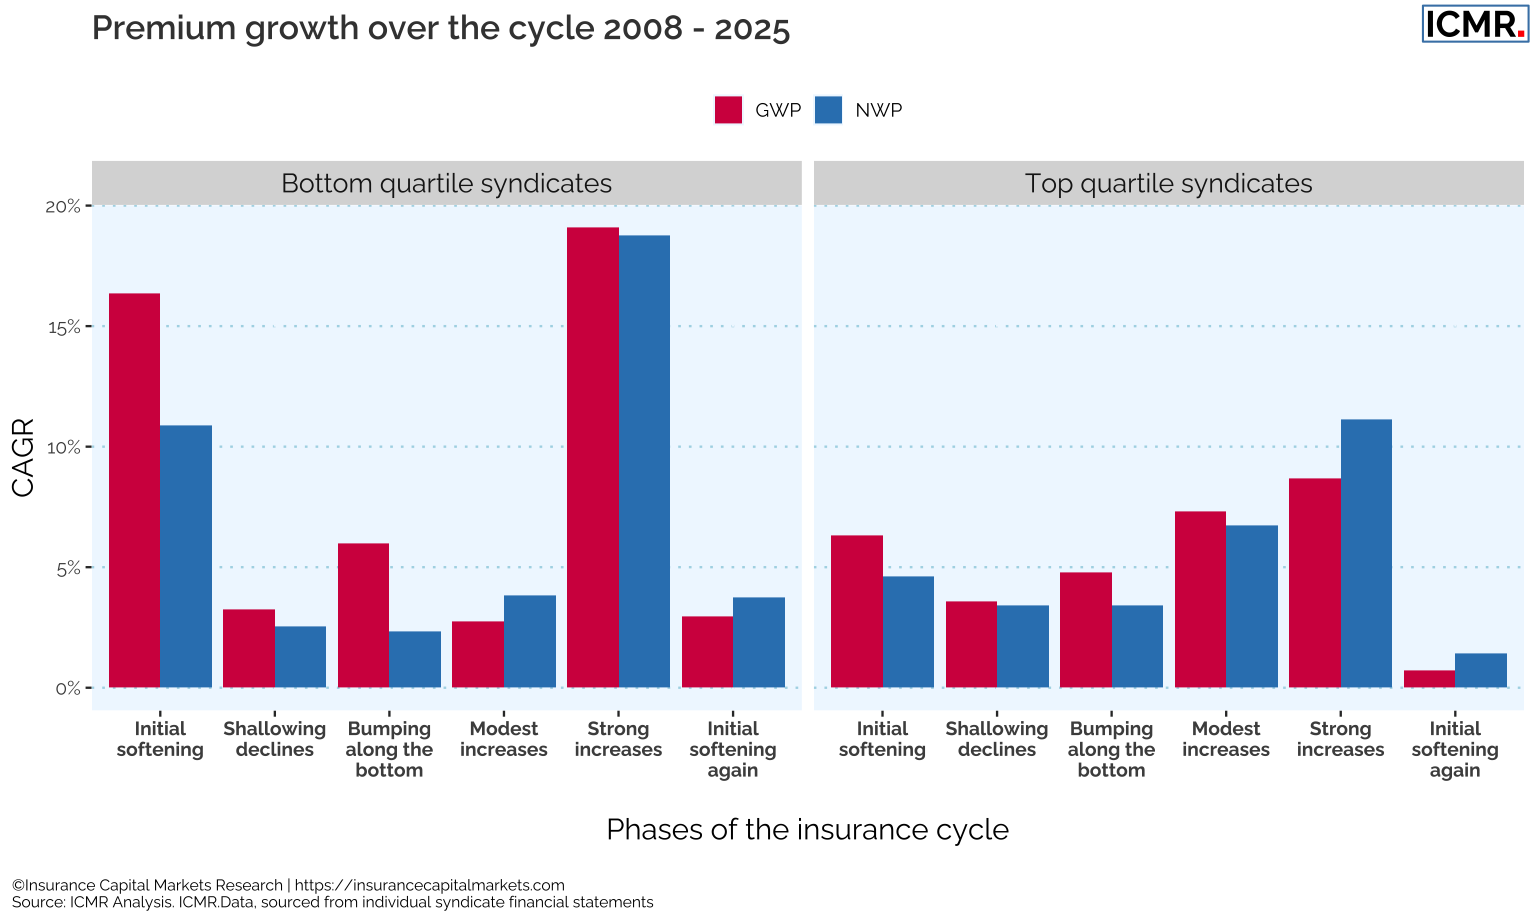
Such an analysis is complicated by the churn of ceased and new syndicates over time as well as the bilateral negotiations between managing agencies and Lloyd’s over who is allowed to grow their syndicates and who isn’t. For the purposes of this analysis, we have looked at the period starting with the pricing declines from the previous post-KRW (Katrina, Rita, Wilma) highs as a proxy for where we are today. The intervening years are designated as Initial Softening (where rate change tends to be at its steepest) followed by Shallowing Declines, Bumping Along the Bottom, Modest Increases, a return to Strong Increases and finally Initial Softening once more.
Whilst this is a subjective view of how pricing cycles manifest, and other perspectives are equally valid, in using this framework certain clear trends begin to emerge.
ICMR has shown repeatedly that relative performance between syndicates tends to be stable, even when absolute performance can be very volatile. Consequently, we maintain league tables of syndicates and it is these that we have used to identify top quartile and bottom quartile performing syndicates. The exact composition of these quartiles will change depending on the dimensions used but we have used returns on capital, using our outside-in ECA by syndicate from our ICMR.Quant capital model.
How the Best Syndicates React to Softening
Looking at the compound annual growth rate (CAGR) of gross written premium (GWP), a clear divergence emerges right from the outset between top and bottom quartile performers. Throughout the varying phases of the cycle, top-tier syndicates consistently demonstrate greater agility, reacting faster to market shifts and managing their net exposure very differently from their lower-performing peers.
As this comparison illustrates, the top quartile doesn’t just manage top-line growth differently; they strategically adjust their net written premium (NWP). When pricing is optimal, they retain more risk on their own account rather than relying on reinsurers to fund undisciplined growth during softer phases.
The differences across the cycle phases can be summarised as follows:
| Cycle Phase | Top Quartile Behaviour | Bottom Quartile Behaviour |
|---|---|---|
| Initial Softening | React fastest; sharply reduce GWP CAGR. | Slower to react; maintain higher GWP CAGR. |
| Bumping Along the Bottom | Maintain disciplined premium reduction. | Increase GWP CAGR significantly, passing a much higher proportion of risk to reinsurers. |
| Early Pricing Increases | React fastest; pivot quickly to increase GWP CAGR. | Slower to capture early rate increases. |
| Strong Pricing Increases | Increase NWP faster than GWP; retain more risk to maximise investor returns. | Catch up on GWP CAGR, but continue sharing more premium (and returns) with reinsurers. |
Growth vs. Discipline: The Reinsurance Factor
Now, it remains perfectly possible that all these observations remain unique to the specific years in which they occurred (2008-2025) but many of the themes chime with anecdotal observations made over the same period. Top quartile performers tend to be longer established businesses which are more reliant on their renewal books and are less likely to chop and change reinsurance arrangements. Bottom quartile performers tend to prioritise growth, even at less propitious times, and are more willing to make use of reinsurance capital whilst doing so. And when pricing eventually strengthens again, top quartile performers seem better able to reflect this more directly in returns to investors than bottom quartile performers who share more of it with reinsurers.
Optimising Portfolios for 2027 and Beyond
Whichever relative performance metrics one attaches importance to as an investor, it’s clear how essential it is to stay on top of individual syndicates’ relative data and information, i.e. when compared to the market as a whole. Only through this kind of observation and assessment of relative syndicate data can an investor optimise their portfolio as market softening gathers pace. Such relative analysis should definitely form part of investors’ considerations around their syndicate participations, particularly if those syndicates’ business plan submissions are still showing material premium growth for 2027.
At ICMR, we remain at the forefront of data provision both through our ICMR.Data subscription (providing subscribers with cleansed syndicate calendar year data within weeks of publication at the end of March each year) and through our analytic models such as ICMR.Insight which provides subscribers with AI-derived probabilistic prospective analytics by syndicate and class of business. For more information, visit https://insurancecapitalmarkets.com.