Benchmarking Capital Allocation: Why Investors Need the 2026 Syndicate Statistics Book
The 2026 Syndicate Statistics book provides the objective, normalised data investors need to isolate true outperformance from market noise.
- The Friction: While Lloyd’s accounting principles are standardised, extracting comparable data from disparate syndicate reports, varying currencies and bespoke broker narratives is incredibly time-consuming.
- The Solution: The 2026 Syndicate Statistics book eliminates this friction, providing a normalised, two-page financial snapshot for every established non-life syndicate.
- The Edge: Proprietary quadrant plots and 5-year aggregated metrics cut through structural noise—such as LPT distortions and bonus allocations—to reveal true market position and consistency.
When evaluating capital deployment opportunities within Lloyd’s, syndicate presentations and broker submissions naturally highlight their most compelling narratives. However, for institutional investors, identifying genuine alpha requires isolating the signal from the marketing noise.
While core accounting practices are standardised across the market, comparing syndicates on a true like-for-like basis remains notoriously difficult. Every managing agency publishes its accounts in separate documents, employing different formatting and varying reporting currencies, all set against a backdrop of complex reinsurance programmes. The 2026 Syndicate Statistics book, published by ICMR, is purpose-built to solve this data friction. By normalising various KPIs, it converts disparate data into a unified, independent framework for rigorous due diligence.
The Power of the Two-Page Snapshot
Time is a premium asset for any investment committee. To maximise analytical efficiency, the book condenses complex financial statements into a highly digestible, two-page analysis for each established syndicate.
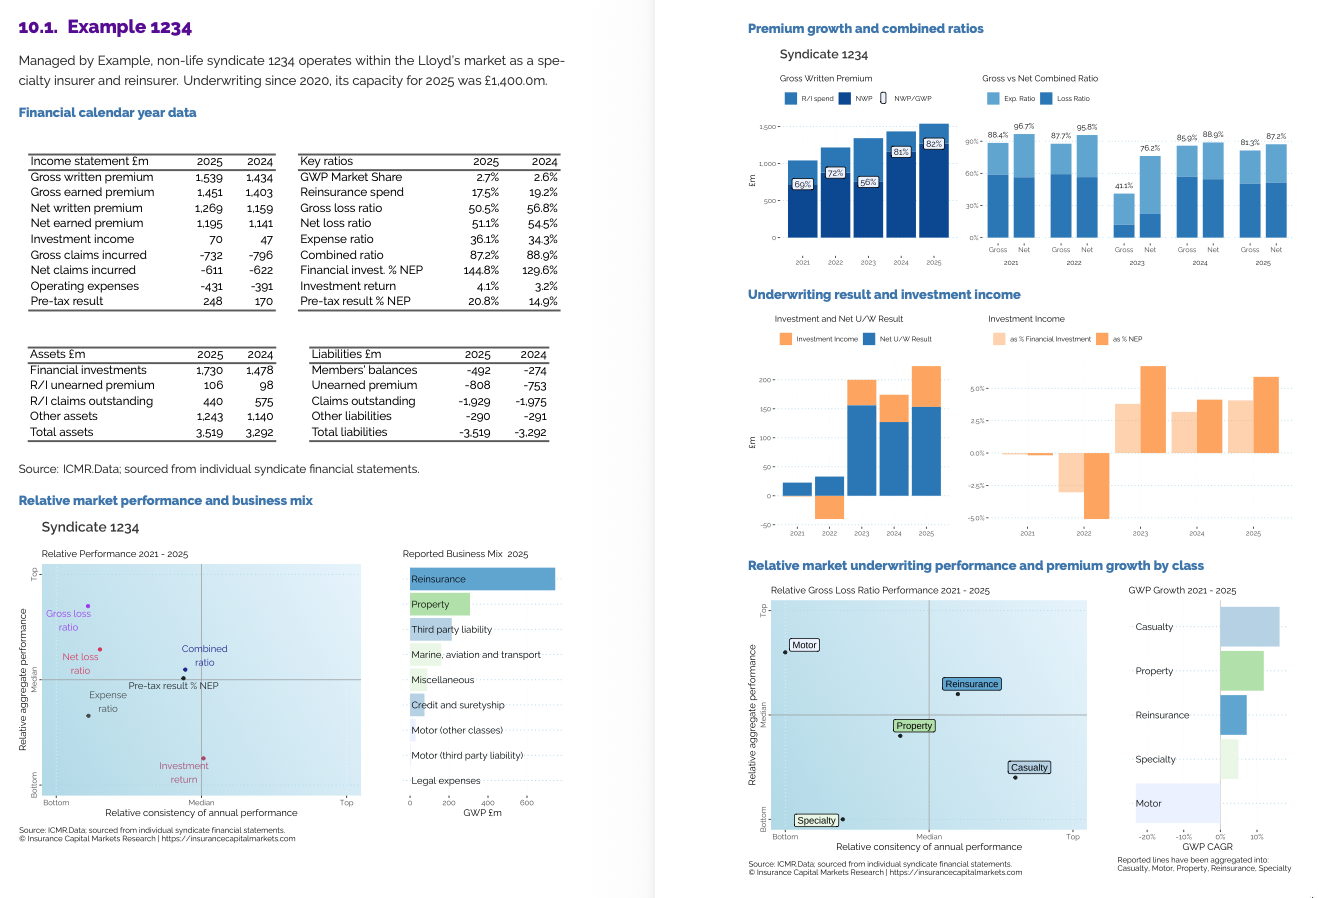
This double-page spread delivers an immediate snapshot, opening with a concise narrative regarding its age and capacity auction price (if traded). The analysis then dives straight into the income statement, balance sheet and key ratios, allowing investors to instantly assess scale, business mix and trajectory.
Institutional-Grade Benchmarking
The book goes beyond simple reporting by standardising key ratios and benchmarking them over a five-year period (2021–2025). Crucially, for metrics like the combined ratio, the numerator and denominator are aggregated over the period first, rather than relying on a simple average. This weighting provides a far more accurate picture of how syndicates actually manage the cycle and what the true impact over the period was.
Inside, investors gain access to:
- Gross vs. Net Performance: Clear tracking of gross and net written premium alongside combined ratios, exposing the true cost and efficiency of a syndicate’s reinsurance strategy.
- Drivers of Profitability: A transparent split between the relative contributions of syndicate investment income against the net underwriting result.
- Asset Leverage: Insight into investment returns as a function of both financial investments and net earned premium, illustrating relative internal asset leverage.
- Line of Business Alpha: A dedicated quadrant plotting the syndicate’s gross loss ratio by class against the market as a whole, mapping all syndicates to a common class of business definition.
Uncovering True Underlying Performance
Raw data always requires critical interpretation. Even with standardised accounting, specific structural variations can materially distort reported performance. For instance, a loss portfolio transfer (LPT) can significantly skew ratios that use net earned premium as their denominator. Intra-group arrangements often heavily shape reinsurance spending and expense ratios are highly sensitive to how specific costs, such as underwriter bonuses, are allocated (e.g., mixed capital syndicates charging them as a syndicate expense versus wholly-owned syndicates charging them externally).
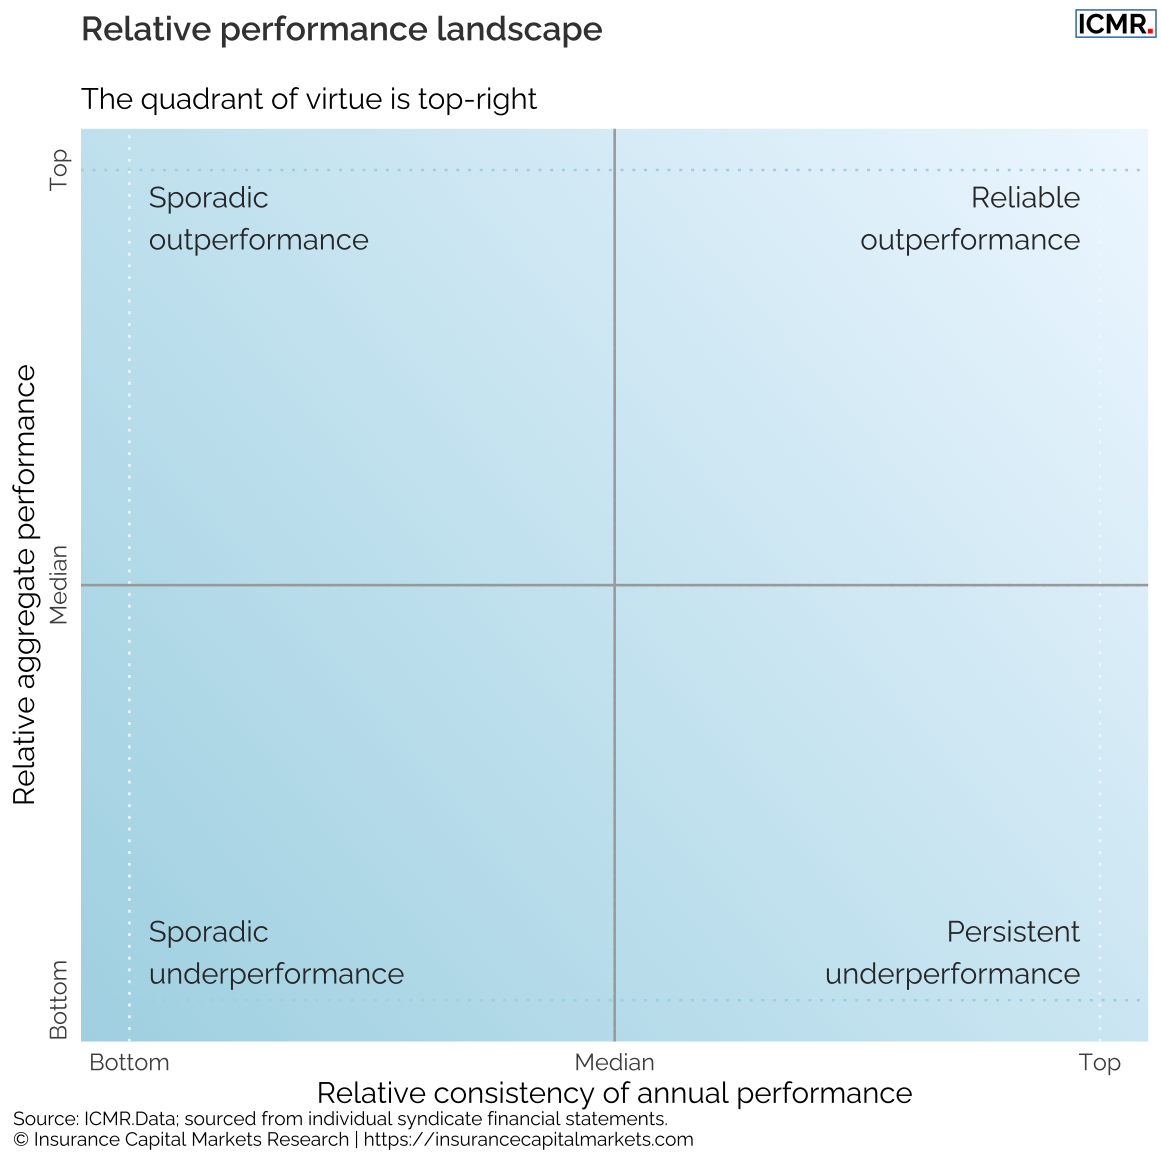
To help investors visually map these dynamics, the book utilises proprietary quadrant plots showing the relative position of each metric in respect of its aggregate performance and annual consistency. This immediately highlights the “quadrant of virtue” (top-right) —identifying syndicates that consistently outperform the market. Conversely, it exposes those in the bottom left that suffer from sporadic or persistent underperformance coupled with volatile results.
Equip Your Investment Committee
Robust due diligence is the bedrock of alpha generation at Lloyd’s. The 2026 Syndicate Statistics book provides the objective, standardised data your team needs to make confident capital allocation decisions.
A hard copy of the full book with all syndicate statistics can be purchased directly from the ICMR website:
The underlying data is also available as part of the ICMR.Data product:
Supported by Industry Leaders
The publication of the 2026 Syndicate Statistics book is proudly supported by our advertisers: Helios Underwriting, Milliman, Artex and Peel Hunt. We thank them for their continued support in bringing this comprehensive market analysis to the Lloyd’s investment community.