Value creation at Lloyd's
Measuring value creation of managing agencies
With the ongoing turmoil of markets in recent weeks, it’s easy to overlook fundamentals in the Property & Casualty industry in general and for Lloyd’s in particular. In this article we present ICMR approach to valuation of Lloyd’s businesses.
Values of publicly traded re/insurers
The traditional steady-state valuation metric used for companies that accept and store risk on balance sheet is their multiple of book value or so-called Price to Book (PB). This information is only readily available for publicly listed companies1.
In order to assess the value of Lloyd’s business we start with the parents of the aligned managing agents that are owned by listed companies. Since 2006 between two-thirds and three-quarters of Lloyd’s total premium was underwritten through managing agents with publicly listed parent companies. It should be noted that there has been a dynamic in this ownership base, with various takeovers, take privates and trade sales, so the gene pool has been renewing itself over time. Yet, we think it a sensible place to start when thinking about value at Lloyd’s.
The chart below shows the range of prices to book for all the publicly listed companies which owned Lloyd’s managing agencies during the years shown of 2006 to 2020.
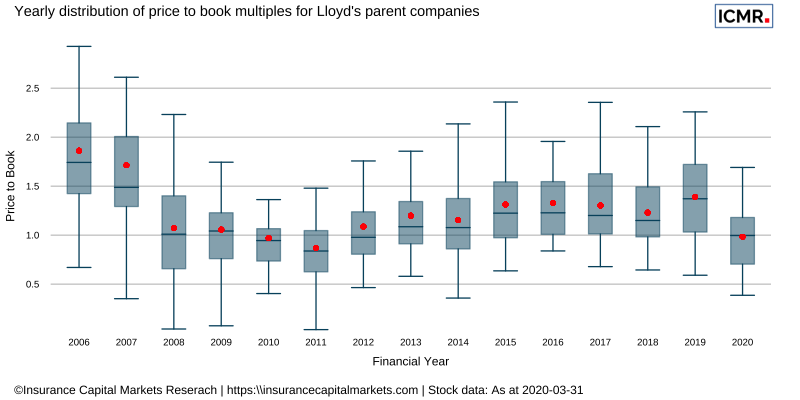
The chart shows a box-whisker plot at each year end of the total distribution of book multiples for these companies, plus the distribution at 31 March 2020. The box denotes the interquartile range, with the line presenting the median and the red dot the mean. The whiskers extend to the most extreme data point which is no more than 1.5 times the interquartile range from the box. The more spread out the box and whiskers, the greater the range of book multiples.
Focusing on the mean values in red, these show a clear cycle. They also clearly show the impact of the financial crisis in 2008 and the recent impact on stock markets of COVID-19. Between the two crises we have seen modest but consistent increases in mean price to book, rising to around 1.3x in 2018 and 1.4x in 2019 (NB - at the time of writing, not all year 2019 end reports & accounts have been received). Recent market turmoil has now pushed this down to 1.0x (so far!).
So, let us overlook market gyrations momentarily by looking at the 31 March 2020 price to book multiple of 1.0x as a sensible place to start when thinking about the value of Lloyd’s as a whole during the COVID-19 crisis. This value would comprise the individual syndicate Funds at Lloyd’s as well as Lloyd’s tangible Central Assets. It’s worth noting that, if we believe this chart illustrates a cycle, an average peak value book multiple of 1.4x to 1.6x is achievable, meaning value creation of up to £16bn for Lloyd’s, based on current book estimates.
But of course, this value won’t be distributed equally or even proportionally across the market.
Value creation by managing agency
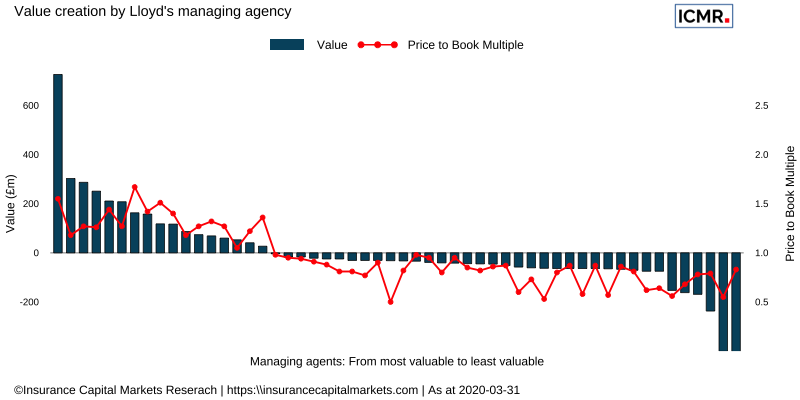
This above chart shows the ICMR outside-in estimates for steady state value created by each managing agent, starting with the largest value creation and ending with the smallest on the left hand axis. The red line shows our estimate of the price to book for each of the corresponding managing agencies from our own outside-in estimate of individual Funds at Lloyd’s requirements on the right hand axis. We refer to this being steady state value as it doesn’t take into account anything that might skew values, such as M&A activity, and we’ve used the same driver of steady state valuation we extracted from the company data, namely the rolling average return on equity. The higher this rolling average, the higher the price to book and vice versa.
What we can see on this chart is a balance between managing agencies creating value and those with book value multiples of less than 1.0x, bringing the average of the market as a whole to 1.0x. The fact that the red line zigzags is because biggest isn’t always best over the long term and some smaller managing agencies have higher multiples and have therefore created more value than larger agencies.
Clearly, owning the right managing agency can be a very shrewd investment, notwithstanding the platform optionality it gives a global parent company. Some fortunate organisations have acquired managing agencies for less than book value and then gone on to sell them for a considerable profit. Others, formed by their own management, have gone on to sell for between 2.0x and 3.0x their book value. It’s been good business. But does that mean that the majority of value creation at Lloyd’s is restricted to the owners of shares in managing agencies as opposed to, say, the owners of capacity on their syndicates? Only those lucky enough to hold share certificates in managing agents can ultimately benefit?
This brings us full circle. If an investor cannot buy shares in managing agencies but can buy shares in their publicly listed parent company, what could an investor achieve had they had they done so?
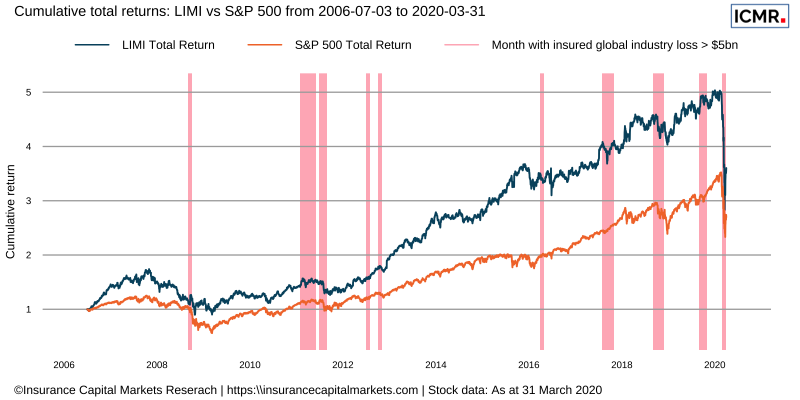
We call this chart our London Insurance Market Index (LIMI) which shows the growth in weighted total return if an investor had bought shares in the publicly listed parent companies of managing agencies in proportion to the relative premium that company underwrite through Lloyd’s each year since 2006.
We can see the significant increase in value achieved since the 2008 financial crisis, and indeed the significant drop since the COVID-19 crisis! For comparison, we’ve shown this against the S&P 500 total return index for the same period. Interestingly, the COVID-19 drop is the same in percentage terms for LIMI and for the S&P 500. Also, the LIMI is still higher (just) post COVID-19 crisis than the peak of the S&P 500 pre-crisis.
So, in terms of participation in ongoing value creation at Lloyd’s, whilst this would appear to accrue solely to the direct owners of shares in managing agencies, there are clearly ways that literally anyone could still participate, for any amount and at any time.
Truly democratisation of value creation at Lloyd’s.
PB = market capitalisation (number of shares multiplied by share price) divided by the trailing shareholders’ equity↩︎