Value creation at Lloyd's: It's not all about the Underwriting Room
The market is buoyant about near term underwriting conditions, but just how important are they to cross-cycle value creation?
Lloyd’s is more than its Underwriting Room
Although undoubtedly Lloyd’s result for 2020 will be a significant loss, the market is buoyant about near term underwriting prospects. Many Lloyd’s players have raised capital during 2020 or freed up capital via loss portfolio transfers to take advantage of improved rating, suggesting renewed focus on the key value driver of underwriting. After all, Lloyd’s is identified with its Underwriting Room, the last true trading floor in London. However, leaving aside the fact that the Covid crisis has shown that trading can take place electronically, how crucial is underwriting to overall returns and cross-cycle value creation?
It was always said that insurance companies were basically investment trusts with a dangerous hobby. This was certainly true for Lloyd’s in the past, as we pointed out in March last year, where historically Lloyd’s Members derived the vast majority of their returns from investment income on both their capital, i.e. Funds at Lloyd’s (FaL), and their syndicates’ float, the difference between premiums collected and claims paid out.
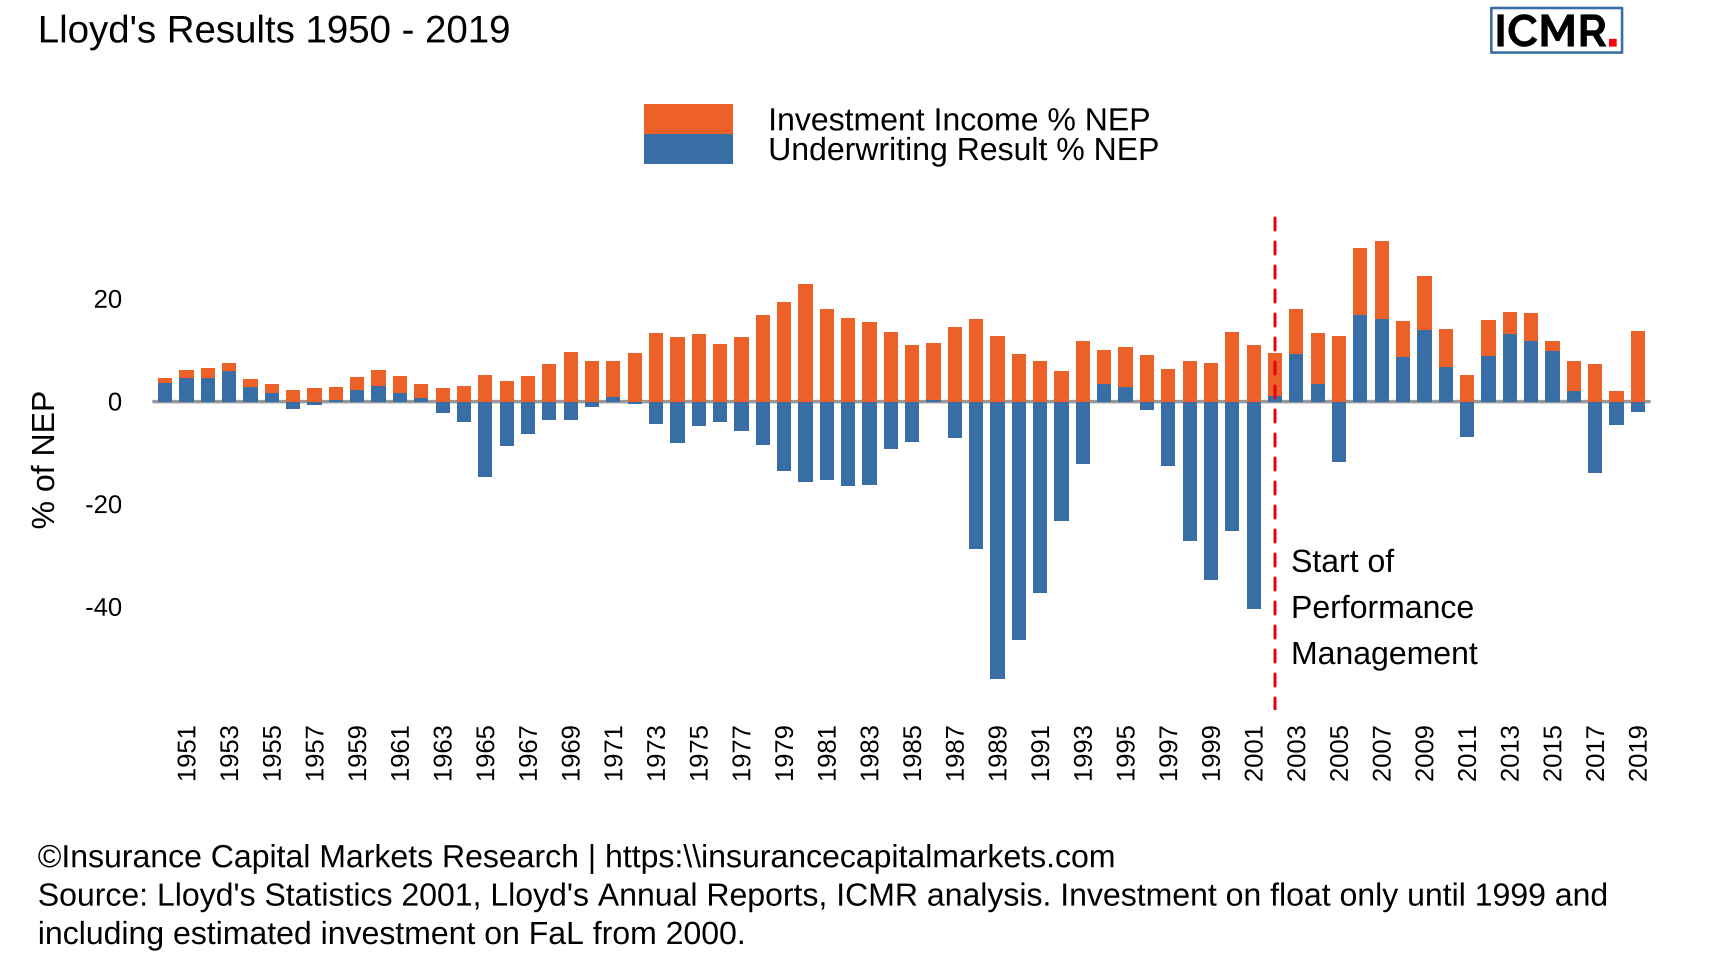
Figure 1: Lloyd’s underwriting and investment results as a ratio of net earned premium (NEP) from 1950 - 2019
The inception of Lloyd’s Performance Management regime in 2003 put the focus firmly on underwriting, but even so, the majority of investors’ returns are not generated from it.
Lloyd’s is more of a Market risk business than many think
Using our ICMR.Matrix we analysed the breakdown of total returns (i.e. including estimated returns on FaL) for all syndicates from 2005 to 2019, split into syndicate peer groupings. The individual syndicate FaL numbers are generated by ICMR.Matrix and are our “outside-in” modelled view. This time horizon will certainly comprise more than a single insurance cycle, but interestingly little changes even if omitting the huge catastrophe year of 2005:
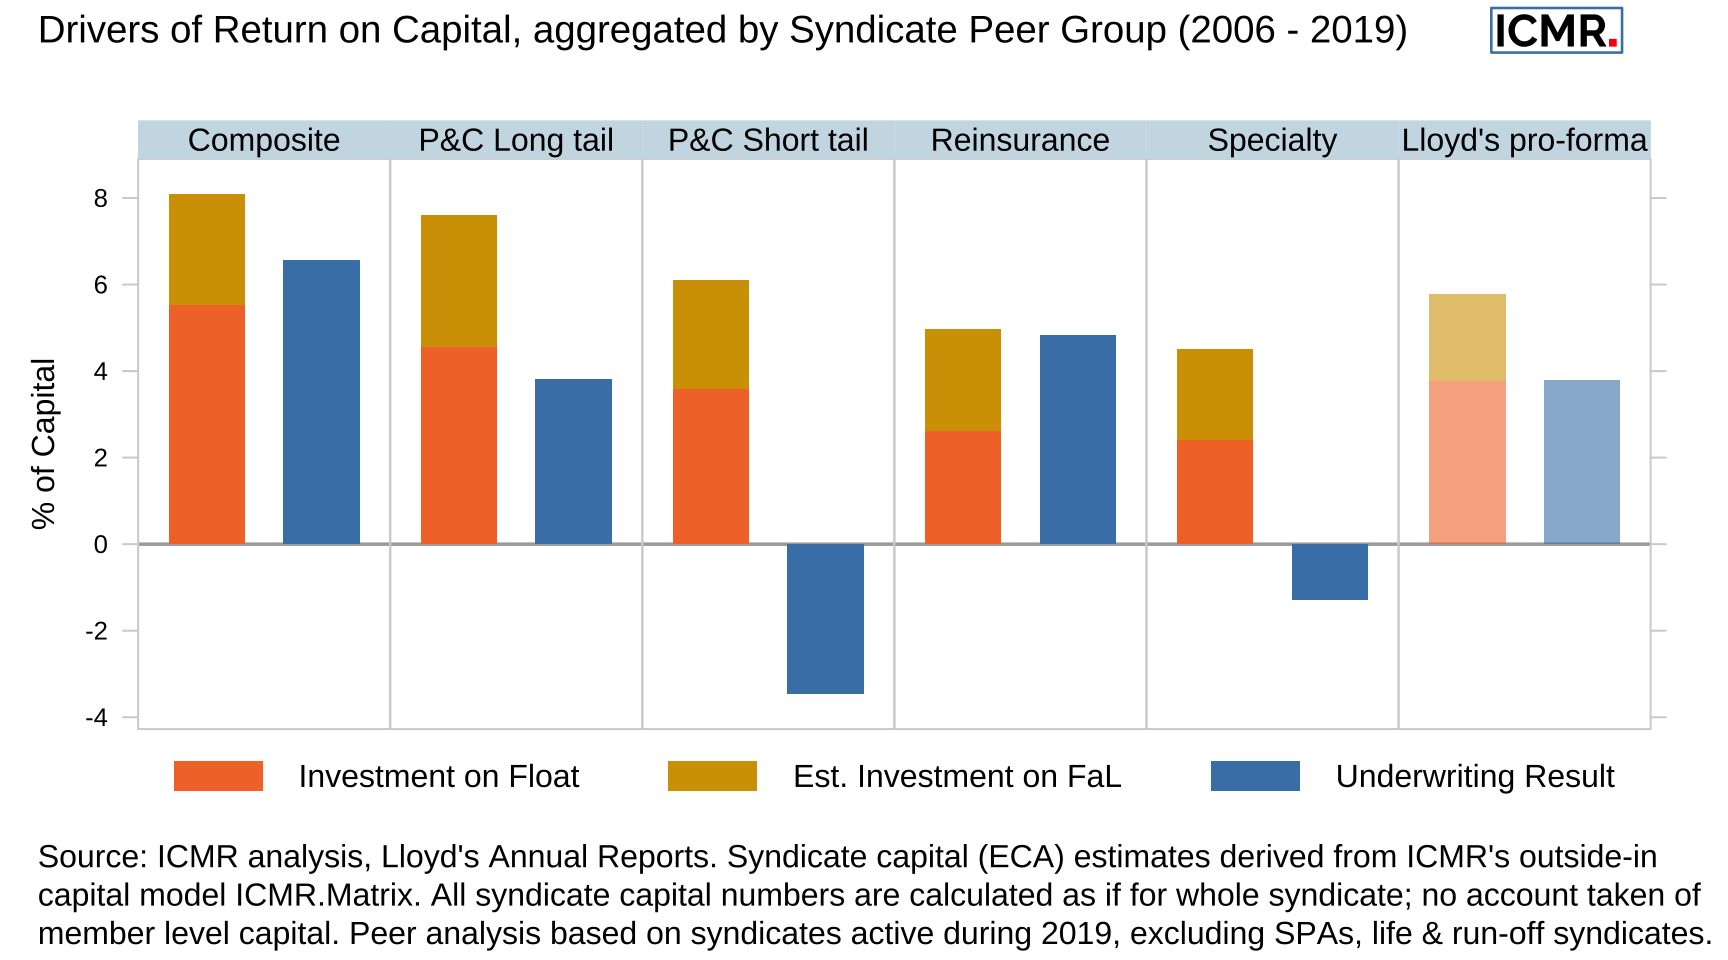
Figure 2: Split of average annual returns on capital between underwriting and investment return over the period 2006 - 2019 for different syndicate peer groups and Lloyd’s as a whole
No matter whether syndicates write short tail business, long tail business, are diversified or catastrophe focused, the majority of their returns to investors have come from the management of their investment portfolios, not their underwriting. The only exception is for unaligned capital and even then only through participation on composite or reinsurance syndicates. If 2020 pans out as we believe it will (with a Lloyd’s market loss of c.£5bn), then the cumulative difference becomes even starker.
Given Lloyd’s asset leverage (the sum of its total invested assets divided by its capital) is about twice its underwriting leverage (the sum of its net premium divided by its capital), improvements in investment would have double the impact of the same improvement in net underwriting which, as shown in April, itself has only yielded a 20-year cross-cycle market combined ratio of 98.5%. Adding 2020 into the mix and the cross-cycle combined ratio will likely exceed 100% for the market as a whole. And that’s with everyone really trying!
Choosing an asset manager may be even more important than choosing underwriters
Nearly all managing agents outsource management of their investment portfolios to specialist service providers. Syndicate annual accounts often mention these arrangements in passing, whilst dedicating many more pages to their reviews of underwriting performance. However, we would contend that choosing the right asset manager is every bit as important as choosing the right underwriters, as their performance can vary materially.
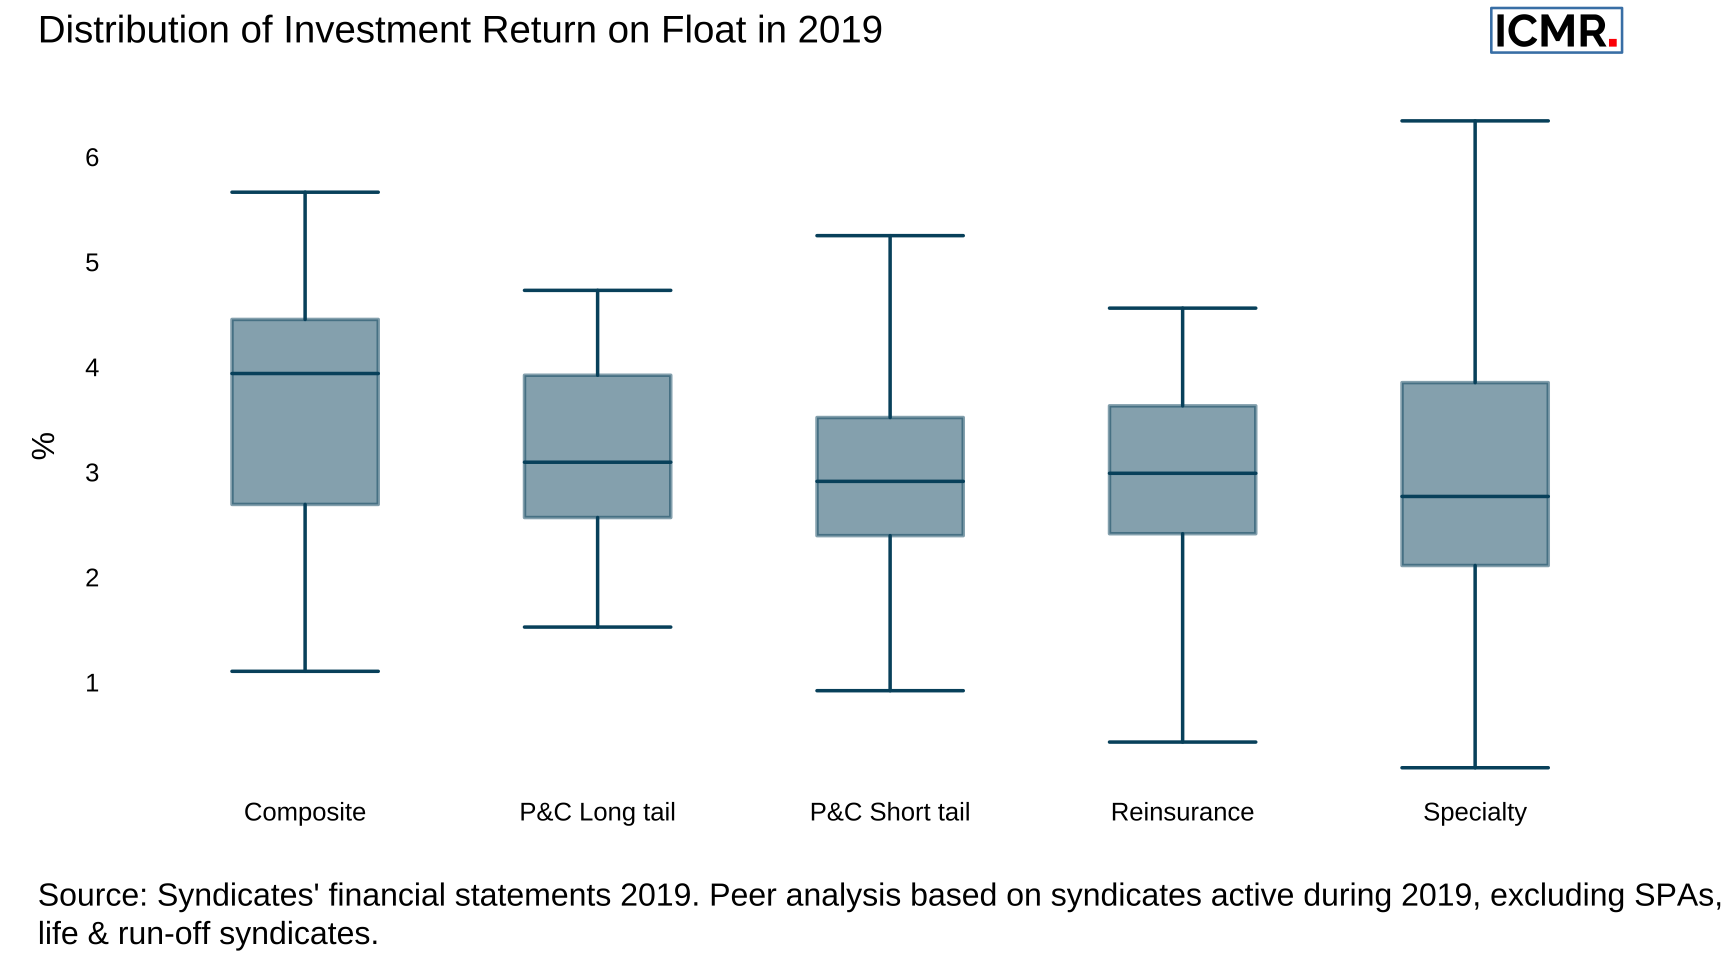
Figure 3: Box-whisker plot of distributions of syndicate investment returns by peer group in 2019. The box represents the inter-quartile range of returns, with the median higlighted as a horizontal line. The whiskers extend to the minimum and maximum of reported investment returns.
The above chart shows the significant variation between reported investment returns achieved on behalf of syndicates in 2019, even when ignoring the outliers and focusing just on the interquartile range. And as mentioned above, asset leverage doubles the impact of this on the bottom line return on capital.
In one of our previous articles we showed the very close relationship between long term returns on capital and distribution percentiles of price to book value multiples. Given how much of Lloyd’s investors’ returns are generated by investments, it shouldn’t come as a surprise that the box whisker plot of ICMR’s calculation of all Lloyd’s syndicates’ book value multiples is not dissimilar to the above chart:
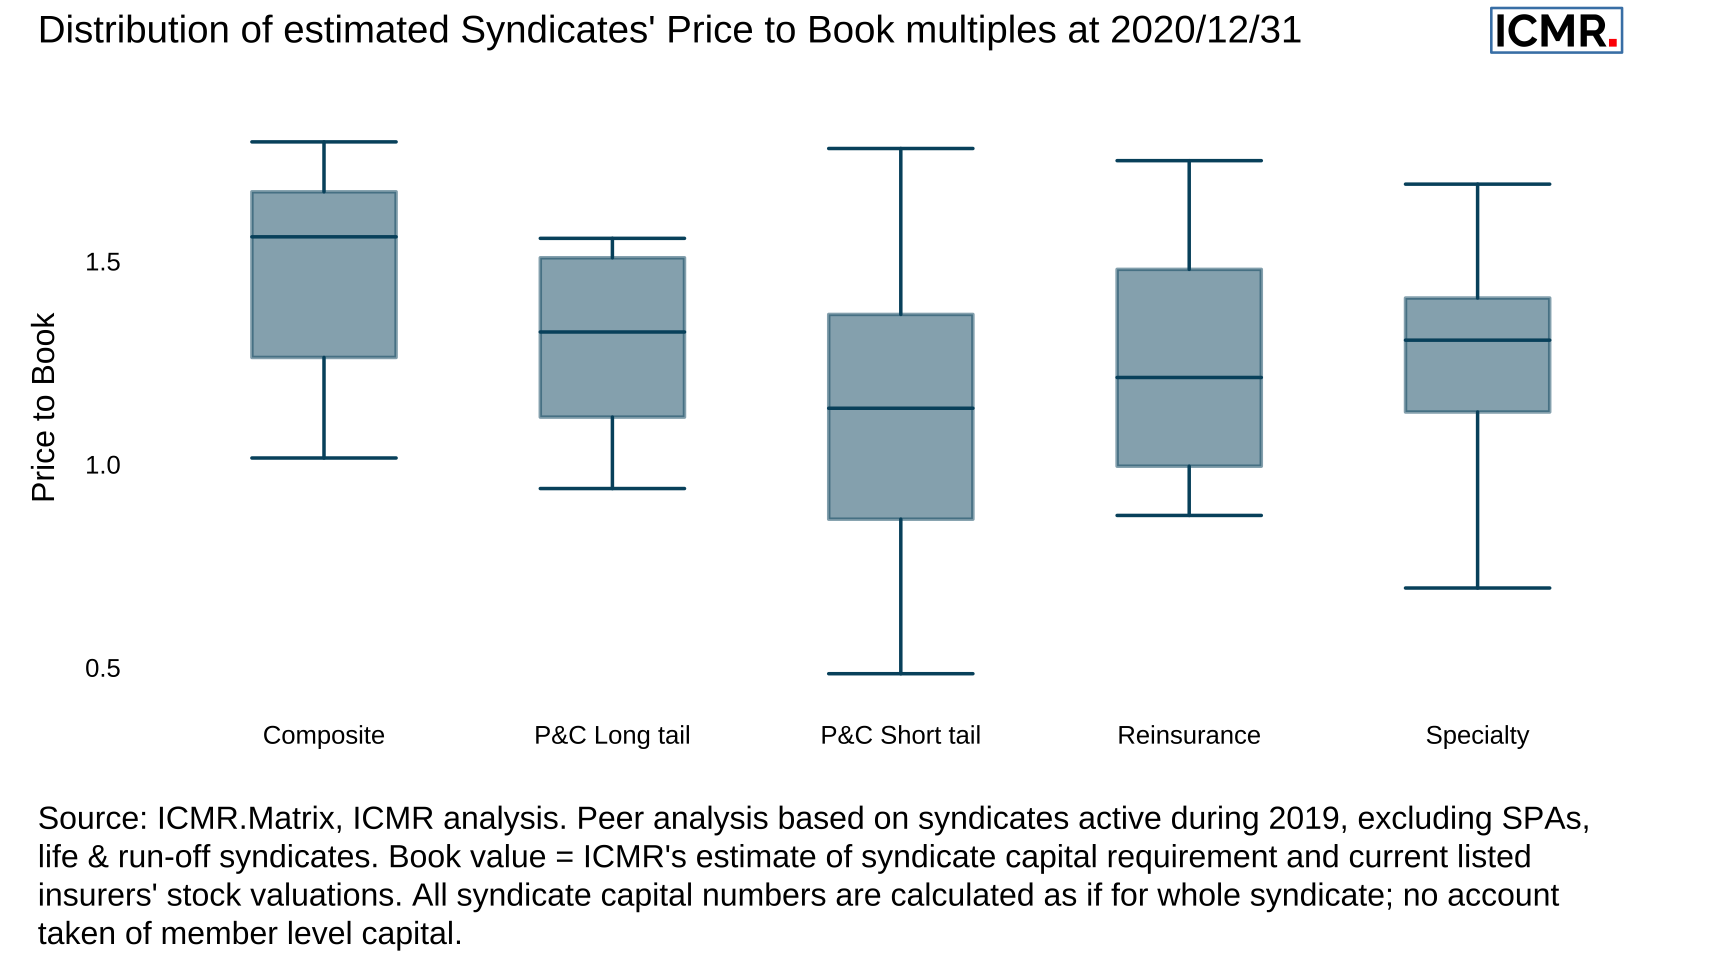
Figure 4: Box-whisker plot of ICMR estimated syndicates’ price to book (P/B) multiples. The box represents the inter-quartile range of P/B, with the median higlighted as a horizontal line, the whiskers extend to the minimum and maximum.
This leads to two interesting conclusions:
Firstly, that the choice and performance of asset managers should perhaps be elevated in importance in syndicates’ annual statements. There is enough variation in asset managers’ performance to alter a syndicate’s overall performance quartile, in terms of returns to their investors. This should be every bit as important as who their underwriters are.
And secondly, syndicates’ asset leverage remains a key component in their overall returns on capital and therefore long term value creation. Perhaps this should give pause for thought in the rush to reinsure reserves to take advantage of short term underwriting improvements.